26 results
Specialty Common Core HSS-ID.B.5 resources
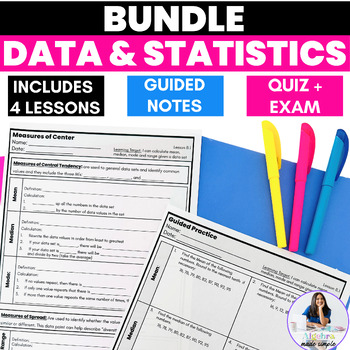
Data Statistics Algebra 1 Skills Scaffolded Guided Notes Unit Practice Test Prep
This complete, ready to print Data and Statistics Unit includes 4 Scaffolded Lessons with Guided Notes focused on measures of central tendency mean, median, mode and range, creating and analyzing dot plots, histograms, frequency tables and box and whisker plots. Each lesson includes Class Notes with Essential Vocabulary, a Guided Practice page along with Independent Practice and Exit Tickets. This Bundle also includes a Student Pacing Page for Notebooks and Binders, along with a Post Unit Exam
Subjects:
Grades:
9th
CCSS:
High School Math Common Core Aligned IEP Goal Bank
This IEP goal bank was created to assist special education teachers with the task of writing standards-based IEP goals in math. After spending countless hours developing IEP goals myself and really having to think through how to best individualize goals and objectives for my own students, I wanted to share this resource to help other special education teachers gain back some of their time.This goal bank includes the following:An introduction and guide that explains how to use the document.Each s
Subjects:
Grades:
9th - 12th
CCSS:
Sports Statistics & Probability curriculum workbook (130+ pages) - Project-based
WATCH THE PREVIEW CLIP! E-MAIL ME FOR DISCOUNTS OR QUESTIONS AT MEDEIROSVINNY@YAHOO.COM.Looking to start an elective math class? Interested in project-based assessments?Tired of teaching statistics with no real-world application?This 132-page interactive workbook serves as a textbook for an introductory statistics math class; complete with Common Core standards crosswalk, embedded answers, and tons of activities and mini-projects. This workbook is the only resource I use for my 'Statistical R
Subjects:
Grades:
8th - 12th
Types:
CCSS:
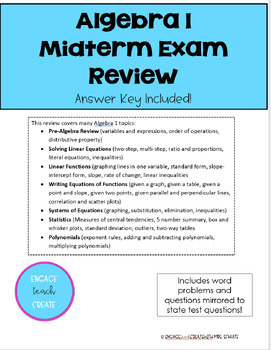
Algebra 1 - Mid-Term Exam Review with Key
This review covers many Algebra 1 topics: · Pre-Algebra Review (variables and expressions, order of operations, distributive property) · Solving Linear Equations (two-step, multi-step, ratio and proportions, literal equations, inequalities) · Linear Functions (graphing lines in one variable, standard form, slope-intercept form, slope, rate of change, linear inequalities· Writing Equations of Functions (given a graph, given a table, given a point and slope, given two points, given parallel and pe
Subjects:
Grades:
8th - 11th
Types:
CCSS:
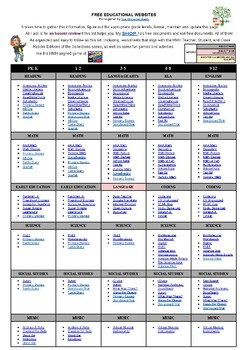
FREE EDUCATIONAL WEBSITES LIST 4 ALL GRADES K-12 AND SUBJECTS + TEACHER RESOURCE
Sometimes, you just need a list of websites for everyone. Here it is. FREE EDUCATIONAL WEBSITES Put together by Teach Me, Maria!It takes time to gather this information, figure out the appropriate grade levels, and format, maintain, and update this page. All I ask is for an honest review if this list helps you.
Subjects:
Grades:
PreK - 12th, Staff
Types:
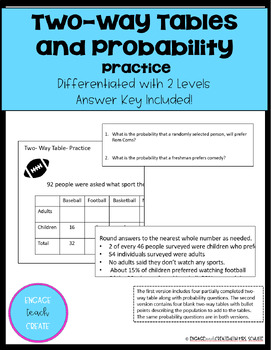
Two-Way Tables and Probability Practice - Differentiated - With Key
This activity includes 4 two-way tables and corresponding probability questions. The first version is differentiated as a partially completed table. The second version includes bulleted descriptions helping students find the missing information. An answer key is provided at the end of the document.
Subjects:
Grades:
7th - 10th
Types:
CCSS:
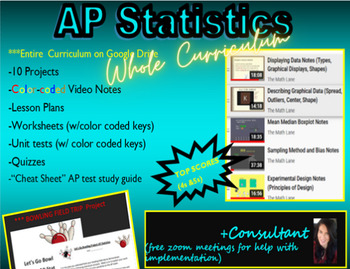
AP Statistics/Stats FULL Curriculum LINK (notes, wksts, PROJECTS) and Consultant
Get ready to supercharge your students' AP Statistics experience with this dynamic curriculum! With over 50% of students earning 4s or 5s on the AP exam, this program is proven to deliver top results. Featuring color-coded video notes, worksheets, activities, and 10 engaging projects, this curriculum is designed to keep students engaged and excited about statistics. Plus, with a Bowling Field Trip Project Opportunity included, students will have the chance to apply their knowledge in a real-worl
Subjects:
Grades:
10th - 12th
CCSS:
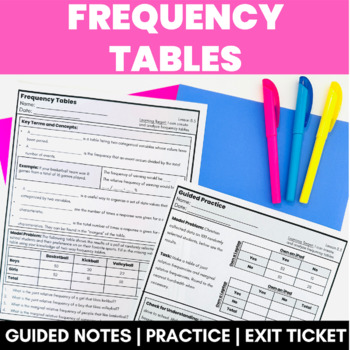
Frequency Tables Scaffolded Guided Notes with Practice Exit Ticket Lesson
These Guided Notes focus on how to create and analyze Frequency Tables. These scaffolded notes can be used in whole-class, small group, 1:1, the differentiation possibilities are endless to teach students calculate joint relative frequencies and marginal relative frequencies. They contain essential vocabulary along with a Guided Practice Worksheet, Independent Practice Worksheet, and Test Prep Worksheet that is aligned with Common Core Standards.➡️ Check out the PREVIEW to see if this resource i
Subjects:
Grades:
8th - 9th
CCSS:
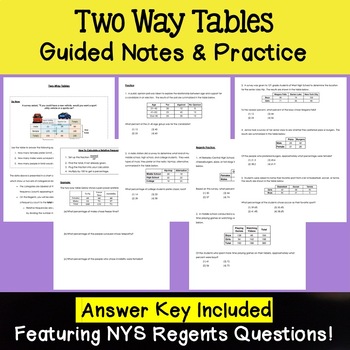
Two-Way Frequency Tables - Notes and Practice - Algebra 1 Regents
This is your perfect resource for two way frequency tables with NYS Algebra 1 Regents questions! The notes are scaffolded and include a Do Now of reading a two-way table, brief guided notes and steps for finding relative frequencies, examples, and Regents practice problems.A full answer key is included. This product can be edited for your students' needs. Perfect for Algebra 1 Regents Prep and can be a great resource for your Special Education students!*Regents problems have been updated to i
Subjects:
Grades:
8th - 10th
CCSS:

Two Variable Statistics with R Studio
This is a Unit on Two Variable Variable Statistics using the free computer programming language R Studio. The unit features 6 lessons, 2 quizzes, and one test.Each lesson has a student google document, a teacher lesson plan, a google slides with help videos for each lesson, and R Studio Code for the lesson.The lessons covers two way tables, relative frequency tables, associations with categorical data, scatterplots and lines of best fit, fitting linear models, and residuals.
Subjects:
Grades:
7th - 12th
Types:
CCSS:

Two Variable Statistics with Python
This is a Unit on Two Variable Variable Statistics using the free computer programming language Python. The unit features 6 lessons, 2 quizzes, and one test.Each lesson has a student google document, a teacher lesson plan, a google slides with help videos for each lesson, and Python Code for the lesson.The lessons covers two way tables, relative frequency tables, associations with categorical data, scatterplots and lines of best fit, fitting linear models, and residuals.
Subjects:
Grades:
7th - 12th
Types:
CCSS:
The Data Driven Teacher
Your classroom is full of data points of which you can be made aware. The purpose of this book is to set out the methods by which you, a teacher practitioner, can collect, analyze, and use data in the context of a teaching and learning environment. It focuses on helping you develop tools to model classroom data from the following components of the classroom: student relationshipsclassroom disciplineclassroom discoursecurriculum developmentassessment of masteryThe methods this book presents to
Grades:
Not Grade Specific
Types:
CCSS:
Bivariate Data Analysis Project
First and most importantly this project is easily applicable to different data sets!!!!
I created this project to look at real data that hit home to students. We explored variables that they chose. We decided to analyze the relationship between scholar dollars and GPA (I have included a second relation as well).
Scholar dollars are like merits and demerits. At my school it was a system created as a way for students to track behavior and progress. Student would earn or lose these dollars base
Subjects:
Grades:
7th - 9th
Types:
Common Core Algebra I - Unit #10.Statistics
Standard statistical displays of data are reviewed at the beginning of the 10 lesson unit. Box plots are used to compare data sets and emphasize use of the quartiles and interquartile range. Measures of central tendency and dispersion, such as mean and standard deviation, are discussed and interpreted in real world scenarios. Two way frequency charts are used to compare data and bivariate data analyses allow the fitting of data with linear and exponential functions.To access the lesson videos on
Subjects:
Grades:
8th - 10th
CCSS:
High School Interpreting Categorical and Quantitative Data IEP math goals
Do you feel frustrated and overwhelmed with everything on your plate? No need to sweat the small stuff. Relieve your current and future headaches with these premade IEP goals. There is no mixing and matching needed. This premade Interpreting Categorical and Quantitative Data IEP math goals packet is designed to save you valuable time, frustration, and headaches. Simply fill in the bold information to personalize each goal. This is a high school Interpreting Categorical and Quantitative Data IEP
Grades:
9th - 12th
Types:
CCSS:
Also included in: Algebra 1 IEP Math Goals

AP Statistics Problem Set (Unit 1)
A statistics problem set with focus on:- Categorical/Quantitative Variables- Bar graphs/Segmented Bar Graphs- Contingency Tables- Histograms- Mean, median, mode- Five Number SummaryAnswer key available upon request.
Subjects:
Grades:
9th - 12th
Types:
CCSS:
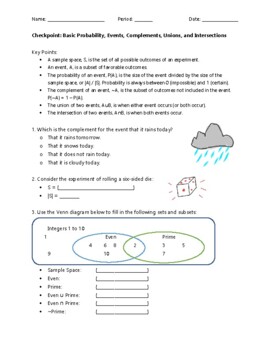
5 Probability Checkpoints Quizzes Homework w/ Key
This PDF includes five two-page checkpoints/quizzes/homework assignments covering high school level probability. Each contains key bullet points and formulas as well as a variety of multiple choice, FITB, matching, numeric, and free-response questions to scaffold learning (about 50 total questions). A key with solutions is included. Topics include events, unions, intersections, frequency tables, conditionals, and mutually exclusive and inclusive events.Checkpoint 1: Basic probability, events, co
Subjects:
Grades:
8th - 10th
CCSS:
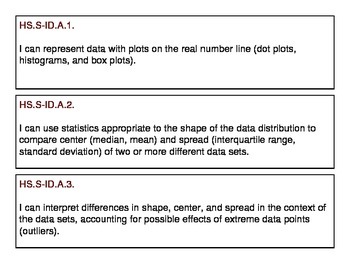
High School Probability and Statistics Concept "I Can" Statement Strips
This file contains all of the CCSS for the "Probability and Statistics" conceptual category in grades 9-12. This PDF can be printed and cut out to post for daily lessons. They will fit a pocket chart or you can add magnets to the back and display them on a magnetic whiteboard. Tabulated sections will keep your strips organized. They will fit perfectly in a file folder system or even a shoebox.
Subjects:
Grades:
7th - 12th
CCSS:
Organizing and Visualizing Data: Population, Sample, Frequency, Graphs and Plots
z
Subjects:
Grades:
8th - 12th
CCSS:

Financial Algebra Chapter 1 Study Guide
This is a study guide based on lessons 1-1, 1-2, and 1-5 of the text book Financial Algebra by Gerver and Sgroi. The topics covered are discretionary expenses with statistics applications.
Grades:
9th - 12th
Types:
CCSS:
Ohio Learning Standards (OLS) for Stats + 'I Can' Statements
Are you required to use the content standards on your lesson plans? And the 'I Can' statements? This product lists the 8 Mathematical Practices, an overview of the Statistics Learning Standards, and then the standards, each one accompanied by an 'I can' statement. The OLS are almost exactly the same as the Common Core State Standards, but for a little bit of the language and the notation. Oh, and this is FREE!
Grades:
10th - 12th
CCSS:
SPSS software Secondary Data Analysis Workshop (Introductory/AP Statistics)
This handout is intended for those interested in teaching/learning basic introductory statistics concepts to analyze real data. Students will learn how to tell a story using secondary data analysis. The handout is for SPSS and the US Longitudinal Study of Adolescent Health data set. For handouts on the data set code book and raw data file, a PowerPoint to accompany the handout, or questions please email kristin.flaming@gmail.com or ldierker@wesleyan.edu.This handout was developed as a condensed
Subjects:
Grades:
6th - 12th, Higher Education, Adult Education
Types:
Translation Code
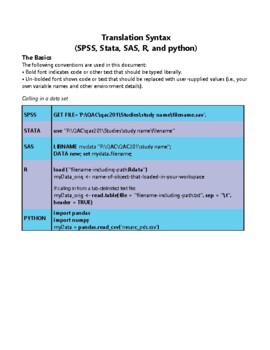
As part of our NSF-funded passion-driven statistics project, we have just started to share more widely our “translation code” aimed at supporting folks in learning code-based software and in moving more easily between them. The pdf includes all of the basic syntax for managing, displaying and analyzing data, translated across SAS, R, Python, Stata and SPSS. http://bit.ly/PDSTranslationCode.For more information about our warm and welcoming data-driven curriculum, check out https://passiondrivenst
Grades:
6th - 12th, Higher Education, Adult Education
Types:
STATA software Secondary Data Analysis
This handout is intended for those interested in teaching/learning basic introductory statistics concepts to analyze real data. Students will learn how to tell a story using secondary data analysis. The handout is for STATA software and the US Longitudinal Study of Adolescent Health data set. For handouts on setting up an account, the data set code book and raw data file, a PowerPoint to accompany the handout, or questions please email kristin.flaming@gmail.com or ldierker@wesleyan.edu.This
Grades:
6th - 12th, Higher Education, Adult Education
Types:
Showing 1-24 of 26 results

