29 results
Applied math Common Core HSS-ID.B.5 resources
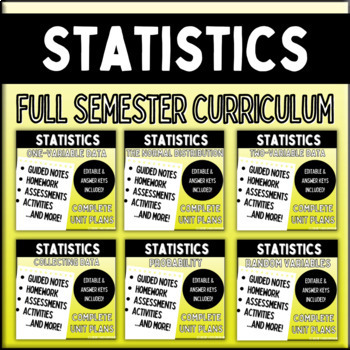
Statistics: FULL CURRICULUM BUNDLE
Statistics: Full Curriculum This is the FULL CURRICULUM bundle for my regular-level, Statistics course. If you are looking for my full curriculum for AP Statistics, follow the link here. This full curriculum is six units long and lasts 1 semester, approximately 90 school days. The following units are included in this bundle: Unit 1 – One-Variable DataUnit 2 – The Normal DistributionUnit 3 – Two-Variable DataUnit 4 – Collecting DataUnit 5 – ProbabilityUnit 6 – Random Variables Each unit contains
Subjects:
Grades:
11th - 12th
Types:
CCSS:
Statistics: Two Variable Data
StatisticsUnit 3: Two-Variable Data Complete Unit Bundle that teaches scatterplots, correlation, linear regression, and more! Welcome! These are the complete unit plans for the third unit in my regular level Statistics class. If you are interested in the AP Statistics unit plans, check out my listing here. Included in this resource: 5 complete sets of student guided notes (annotated answer keys included)5 homework problem sets + complete test review (annotated answer keys included)2 assessments
Subjects:
Grades:
10th - 12th
Types:
CCSS:
Also included in: Statistics: FULL CURRICULUM BUNDLE
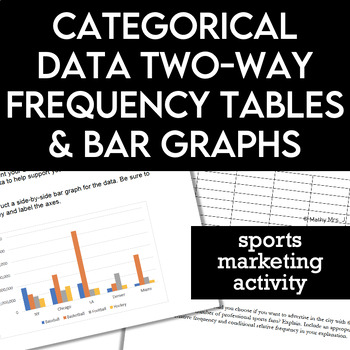
Two-Way Frequency Tables Stacked Bar Graph Sports Marketing Activity
Get students researching and analyzing data with this two-way frequency table activity! Students create side by side bar graphs, stacked bar graphs, calculate frequencies and relative frequencies, and apply their knowledge to a real world situation.How it works: Students gather data to show which sports, teams, and cities have the most sports fans and use the data to make informed decisions about advertising. Students organize the data into tables and graphs and practice finding join, marginal a
Subjects:
Grades:
7th - 10th
Types:
CCSS:
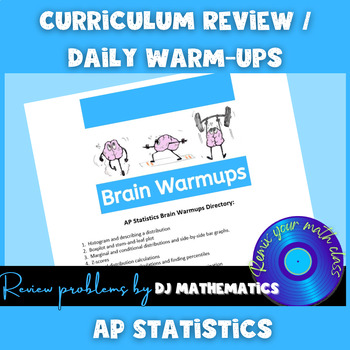
AP Statistics Curriculum Review / Daily Warmups
Introducing the Ultimate AP Statistics Resource!Unlock the potential of your AP Statistics students with a meticulously crafted resource, designed to engage and challenge them while aligning perfectly with the AP Statistics curriculum. Created by a seasoned teacher who achieved a remarkable 80% success rate in guiding students to earn 5's on the AP Statistics exam, this resource is a game-changer for any AP Statistics classroom.What sets this resource apart? It's the infusion of current culture
Subjects:
Grades:
9th - 12th
Types:
CCSS:
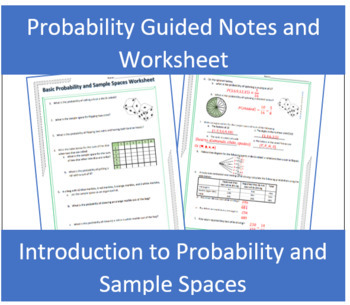
Introduction to Probability and Sample Spaces Guided Notes and Worksheet
The Introduction to Probability guided notes with examples is the perfect introduction to what probability is, how to find basic probability, and sample spaces. These notes were made for a high school geometry level course, but could be used to introduce probability in statistics or an honors middle school level course. There is an optional dice activity included in one version of the guided notes (a version of notes is provided without the dice activity as well if you do not want to do this or
Subjects:
Grades:
6th - 12th
CCSS:
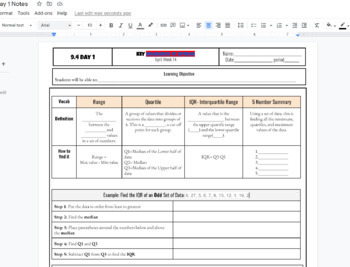
IQR interquartile Range and 5 number summary box and whisker plot Notes
IQR interquartile Range and 5 number summary box and whisker plot Notes including Q1, Q2, Q3, Min and Max and step by step both examples of finding the IQR and creating a box and whisker plot. Used in HS math 1 class WITH KEY INCLUDED AS a link to a printable PDF
Subjects:
Grades:
7th - 12th, Higher Education, Adult Education
CCSS:
AP Stat Unit 1,2,3 Describing Data, Linear Regression, Experiments/Sampling
This bundle includes complete guided notes, homework, and editable quizzes for the first 3 units of AP Statistics. The bundle also includes three FBI Most Wanted activities to use with the units and an activity to use with students during the first few weeks of school.
Subjects:
Grades:
9th - 12th
Types:
CCSS:
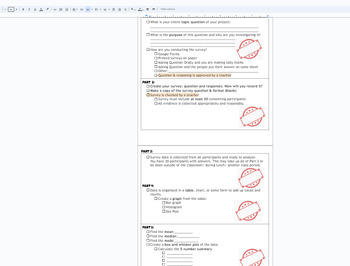
Statistics Survey project Discovery (broken down into sections) with Rubric
This is a broken down (scaffolded) packet of instructions/ guide for a Stats Project for Math 1 HS or 8th grade students. The goal of the project is for students to take a statistical survey on quantitative data (numbers) of their choice. Using this data from the survey, the following will be included in the project:Survey- the question being askedSurvey responses (requirement of 30)Data organization: Bar chart, Histogram, Dot PlotMeanMedianModeBox and Whisket Plot5 number summary (Q1,Q2,Q3, min
Subjects:
Grades:
7th - 12th, Higher Education, Adult Education
CCSS:
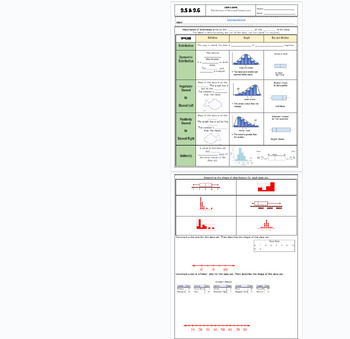
Data Distribution positive/negative skewed fillable notes UPDATED
Unit 9: Data and Stats: Updated(No 9.3/ Skip)9.5/9.6 Data Distribution (skewness)Students go over the vocabulary and complete the examples with the vocabulary scaffolded. Skewness is explained and how to identify it comparing data charts and box and whisker plots. Uses many visuals and examples to differentiate between that different graphs. Notes are scaffolded. Includes hook video hyperlinked on the "learning objective" title. Key is included and hyperlinked as a PDF in the heading highlighted
Subjects:
Grades:
6th - 12th, Higher Education, Adult Education
CCSS:
Also included in: Unit 9: Data and Statistics Fillable Notes
Data and Statistics (DS) Bundle
Shape, center and spread, the normal distribution, sampling and linear regression are all explored in this introduction to statistics. These missions are aligned with Common Core Standards from the Statistics and Probability category for 8th grade and high school.
The fun stuff:
Heart rates and marathons, coins and NBA heights, this bundle gives students the chance to explore shape, center, and spread with coins, dice, heights, shoe sizes and more. They also explore linear regression and even
Subjects:
Grades:
7th - 12th
CCSS:

Unit 9: Data and Statistics Fillable Notes
Unit 9: Data and Stats(No 9.3/ Skip)9.1 Central Tendencies: Mean, Median and Mode9.2 Graphical Data: Bar Charts, Dot Plots and Histograms9.3 NONE9.4A 5 number summary and box and whisker plots 9.4B Standard Deviation9.5/9.6 Data Distributions (skewness) left or right9.7 Frequency Tables and relative frequency tablesStudents go over the vocabulary and complete the examples with the vocabulary scaffolded. Notes are scaffolded. Includes hook video hyperlinked on the "learning objective" title. Key
Subjects:
Grades:
6th - 12th, Higher Education, Adult Education
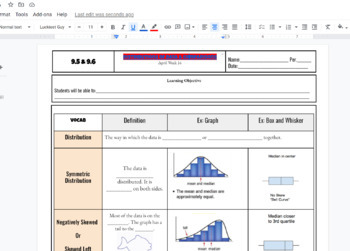
Distributions of Data Scaffolded Fillable Notes (Skewed Left & right) w/ KEY
Distributions of Data Scaffolded Fillable Notes (Skewed Left & right) Includes a problem of creating box plot, bar chart, and dot plot. KEY IS INCLUDED linked at top of title highlighted in red!!! , Algebra 1 or Math 1 class in highschool setting IEP 504 EL learners visuals for better understanding. YOU CAN EDIT THE GOOGLE DOC to your liking!!!
Subjects:
Grades:
7th - 12th, Higher Education, Adult Education
CCSS:
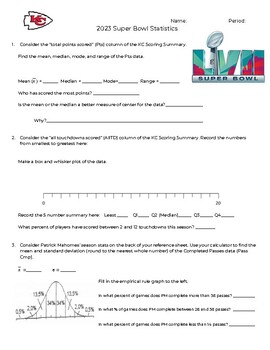
2023 Super Bowl Statistics Activity
This activity contains two stats sheets - one for the Philadelphia Eagles and one for the Kansas City Chiefs. Students are asked to use the data from the various tables to answer questions about the teams. This activity covers 1 variable statistics (mean, median, mode, range, standard deviation, box-and-whisker plot, histogram, two-way tables).This would be great as a partner activity or class activity.
Subjects:
Grades:
7th - 12th
Types:
CCSS:
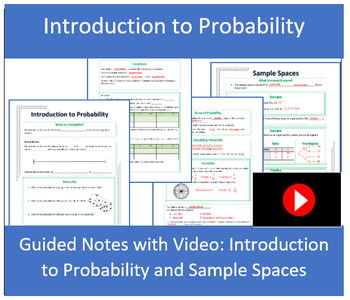
Introduction to Probability and Sample Spaces Guided Notes with Video
The Introduction to Probability guided notes with examples is the perfect introduction to what probability is, how to find basic probability, and sample spaces. These notes were made for a high school geometry level course, but could be used to introduce probability in statistics or an honors middle school level course. There is an optional dice activity included in one version of the guided notes (a version of notes is provided without the dice activity as well if you do not want to do this or
Subjects:
Grades:
6th - 12th
Types:
CCSS:
Also included in: Probability Unit Guided Notes and Practice with Videos
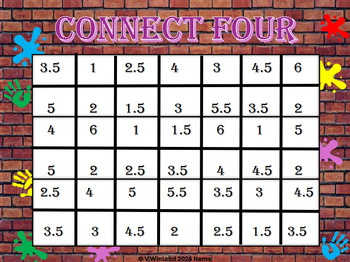
Connect Four ( Statistics)
Statistics Connect FourConnect four by rolling dice and finding averages.Students have to keep track of frequency and relative frequency.Also create a histogram and decide if frequencies create a uniform, normal curve or skewed curve.
Subjects:
Grades:
10th - 12th, Higher Education, Adult Education
Types:
CCSS:
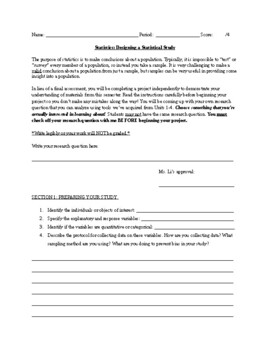
Statistics Project: Regressions + Designing a Statistical Study for High School
Hello!I've designed a statistics project that students in my class loved! This project requires students to go collect data on a topic that interests them. They have to design a sampling method that is as unbiased as possible. Students are then required to analyze their data and summary statistics. They also need to do a regression analysis on their study and make inferences using their results. This is perfect for a replacement of a test or as an end-of-semester project for students. Perfect fo
Subjects:
Grades:
9th - 12th, Higher Education
Types:
CCSS:
Also included in: AP Statistics / High School Statistics Projects
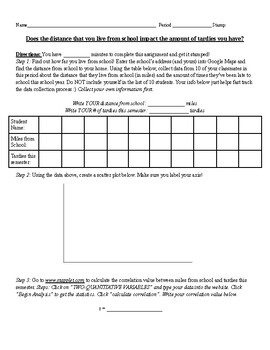
Correlation and Least Squares Regression Line Activity: High School Statistics
Hi! This activity will take 40 minutes to 1 hour to complete. It requires students to collect data from their classmates and use the data to do a regression analysis. The activity provides a statistical analysis website plus instructions for students to do regression analysis calculations. The materials students will need include a computer. Optional materials include a calculator. This activity can be provided on Google Classroom or printed as a physical copy for students to write on (preferred
Subjects:
Grades:
9th - 12th
Types:
CCSS:
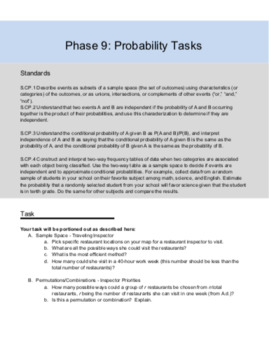
HS Geometry City Restaurant Inspector Project - Probability
This project leads student through the Probability unit of Geometry in learning about Fundamental Counting Principle, Permutations and Combinations, Compound Events, and Two-way Frequency Tables. Students will follow a restaurant inspector through the city they designed (free resource here) to demonstrate these concepts.This purchase includes a task sheet for students describing the project, a report template for students to provide their information, a rubric, tips on helping students with rese
Subjects:
Grades:
9th - 12th
CCSS:
Also included in: HS Geometry City Design Bundle
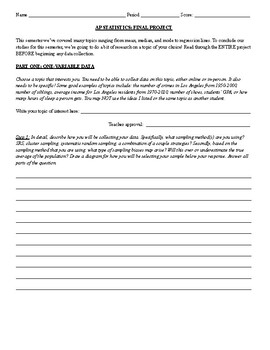
AP Statistics Project: Normal Distributions, Regression Analysis, and Sampling
If you are looking for a cumulative project that summarizes the three topics relating to: one-variable data analysis, two-variable data analysis, and sampling methods, this is a great project to provide to your regular or AP Statistics students. Topics covered in this project include normal distributions, scatterplots, correlation, regression analysis, sampling methods, sampling biases, and statistical thinking. It covers Unit 1, Unit 2, and Unit 3 materials in the AP Statistics suggested course
Subjects:
Grades:
11th - 12th
Types:
CCSS:
Also included in: AP Statistics / High School Statistics Projects
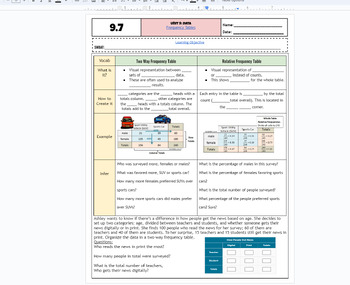
Frequency Tables & Relative Frequency Tables fillable notes UPDATED
Unit 9: Data and Stats: Updated(No 9.3/ Skip)9.7 Frequency Tables Students go over the vocabulary and complete the examples with the vocabulary scaffolded. Students examine a categorical table/frequency table and also use that information to create relative frequency tables. Different real-world examples and problems are used. Emphasized how percents and decimals are calculated. Notes are scaffolded. Includes hook video hyperlinked on the "learning objective" title. Key is included and hyperli
Subjects:
Grades:
6th - 12th, Higher Education, Adult Education
CCSS:
Also included in: Unit 9: Data and Statistics Fillable Notes
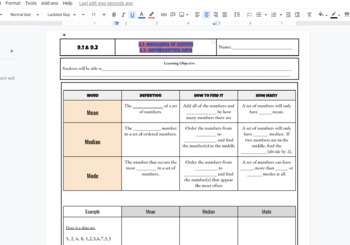
Mean, Median, Mode and Dot plot, bar graph histogram Fillable Notes Scaffolded
Central Tendencies: Mean, Median and Mode Fillable Notes Scaffolded used in math 1 classroom to introduce the data unit. Also includes dot plot, histogram and bar chart lesson. KEY IS INCLUDED!
Subjects:
Grades:
7th - 12th, Higher Education, Adult Education
CCSS:
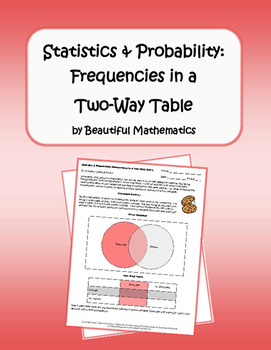
Statistics & Probability: Frequencies in a Two-Way Table
Great visual tool for learning about frequency tables!!!Students will understand that patterns of association can also be seen in categorical data by displaying frequencies and relative frequencies in a two-way table. Construct and interpret a two-way table summarizing data on two categorical variables collected from the same subjects. Use relative frequencies calculated for rows or columns to describe possible association between the two variables.Please follow me to hear about new discounts, f
Subjects:
Grades:
8th - 10th
CCSS:
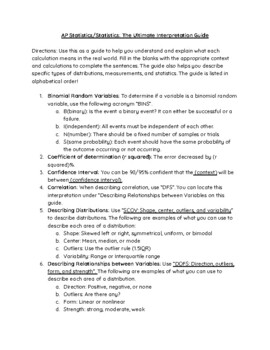
AP Statistics: Interpretations Guide: What does each statistic mean?
Hi teachers! This resource is great for your elementary, regular, or AP Statistics course. Students can use this guide all year long. We want our students to actually understand what they are calculating and connect their learning to real-world contexts! This resource will help them do just that. Some interpretations covered are mean, median, mode, and more. Here are the directions for use of the interpretations guide: Directions: Use this as a guide to help you understand and explain what each
Subjects:
Grades:
7th - 12th
CCSS:
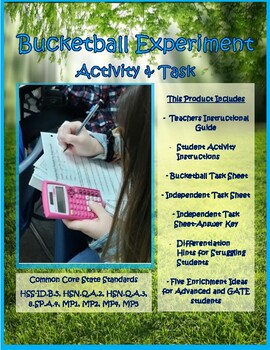
Bucketball Experiment Activity & Task
The Bucketball Experiment Activity & Task gives students an opportunity to practice gathering random data, organizing that data into a table, and then determining the relative frequency of the data in a context that is fun and personal. This activity/task has two parts. First students participate in the Bucketball Experiment Activity and record their raw data. Once that is completed and shared between teams, students will partner up to complete the second part, Bucketball Experiment Task. Th
Subjects:
Grades:
8th - 10th
Types:
CCSS:
Showing 1-24 of 29 results


