31 results
Physical science Common Core 8.F.B.5 resources
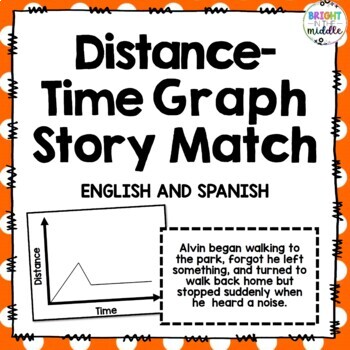
Distance-Time Graph Story Match: 7.P.1.3, 7.P.1.4, 8.F.5 - PRINT AND DIGITAL
This is not your average distance-time graph worksheet! This is a cut-and-glue activity that gets students engaged in learning common distance-time graphs related to real-life scenarios. Students learn the meaning of horizontal, diagonal, and curved lines. Students will not even realize that they are learning! Science and Math all in one!This activity covers 7.P.1.3, 7.P.1.4, and 8.F.5*A Spanish version and a digital version is now included!⭐Want a digital interactive lesson to go with this? Dis
Subjects:
Grades:
6th - 8th
Types:
CCSS:
Also included in: Distance-Time Graph Bundle: 7.P.1.3, 7.P.1.4, 8.F.5
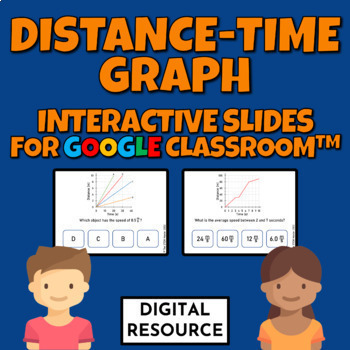
Distance-Time Graph Interactive Google Slides Game for Google Classroom
Math, Physical science digital interactive Google Slides activity covering distance-time graphs, speed, velocity, time, distance, interpreting motion graphs. Digital interactive science task cards for Google Slides, Google Classroom, Digital resource Distance Learning.2 challenges with 10 self-checking multiple-choice questions each❗❗The students use the present mode and click on the correct answer to move to the next problem⚡️⚡️⚡️BIG Bundle of Physics⚡️⚡️⚡️⭐⭐⭐BIG Bundle of Chemistry⭐⭐⭐⭐Digital
Subjects:
Grades:
6th - 9th
Types:
CCSS:
NGSS:
MS-PS2-2
Also included in: Physical Science Chemistry Physics Digital Resource MEGA Bundle
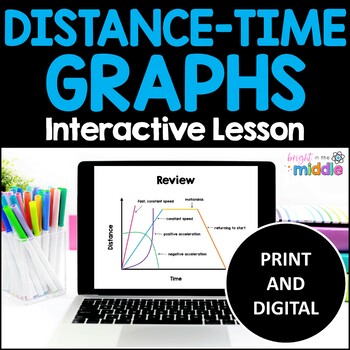
Distance vs. Time Graphs
This is an interactive lesson, review, and practice for teaching about distance-time graphs. This package includes a link for a Google slides version of the lesson a practice as well as a PowerPoint version. This lesson reviews many distance-time graphs examples.⭐ This distance vs. time graphs lesson is great for reducing cognitive load in the science classroom!A PRINT and DIGITAL version is included.So what is included?:Interactive lesson/review for:motiondistance versus time graphsgraphing con
Subjects:
Grades:
6th - 8th
Types:
CCSS:
NGSS:
MS-PS2-2
Also included in: 7th Grade Science Resources Bundle
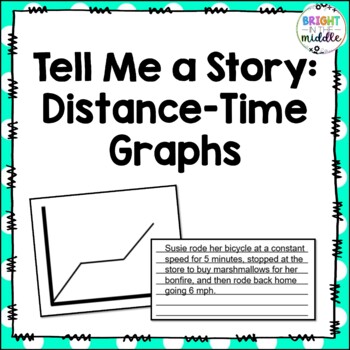
Distance-Time Graphs Worksheet - Tell Me A Story - 7.P.1.3, 7.P.1.4, and 8.F.5
Need a distance-time graphs worksheet/activity? It's Science and Math all in one! In this activity, students must create a story on what they believe the graph is showing. An example is given for them. This activity covers 7.P.1.3, 7.P.1.4, and 8.F.5.✅ Download the preview and check out the sneak peek inside!Want a interactive lesson to go with this?Distance-Time Graphs Digital Interactive LessonIt's important for students to understand distance-time graphs and how motion is graphed. This distan
Subjects:
Grades:
5th - 8th
Types:
CCSS:
Also included in: Distance-Time Graph Bundle: 7.P.1.3, 7.P.1.4, 8.F.5
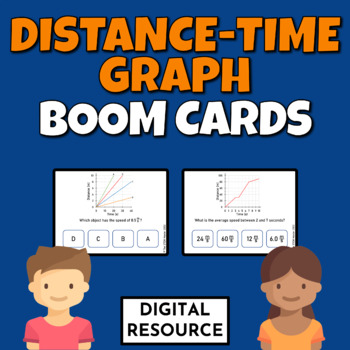
Distance-Time Graphs Math Digital Boom Cards Digital Resource
Math, physical science digital interactive Boom Cards covering distance-time graphs, speed, velocity, time, distance, interpreting motion graphs. Digital resource Distance learning.20 cards▶️preview✅Interactive Google Slides version⚡️⚡️⚡️BIG Bundle of Physics⚡️⚡️⚡️⭐⭐⭐BIG Bundle of Chemistry⭐⭐⭐⭐Digital Chemistry Worksheets Bundle✅Physical Science Equation Worksheets Bundle✅Physical Science Graphing Digital Worksheets Bundle for Google Classroom™Common core assessments:✅✅✅Grade 3 Math CCSS Assessm
Subjects:
Grades:
6th - 9th
Types:
CCSS:
NGSS:
MS-PS2-2
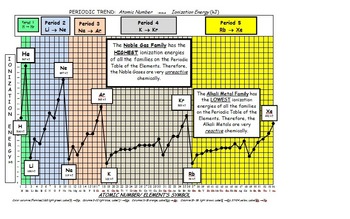
The Periodic Trends of Ionization Energy
This graphing activity, Atomic Number vs. Ionization Energy, will help students grasp a very difficult, but critical, concept in chemistry. This graphing activity includes 3 graphing worksheets for varying levels of ability. Data sheets of the first 54 elements and their ionization energies are also included. A completed graph is included.
Students will observe how ionization energy changes from left to right across the periodic table and from top to bottom of a family. These worksheets will h
Subjects:
Grades:
8th - 12th
Types:
CCSS:
Scientific Thinking Unit Bundle
3 fully editable, NGSS/modeling pedagogy aligned worksheets, 4 inquiry labs, 3 lab challenges, 2 quizzes, 6 guided notes/reading assignments, 1 unit review, 1 writing assignment, 1 equation toolbox, and 1 curriculum guide!WorksheetsThere are a variety of free response questions for most worksheets, which are usually one or two pages long. Worksheets are used for students to deploy models developed from inquiry labs and as a way to practice problem-solving en route to mastery of learning targets
Subjects:
Grades:
7th - 12th
Types:
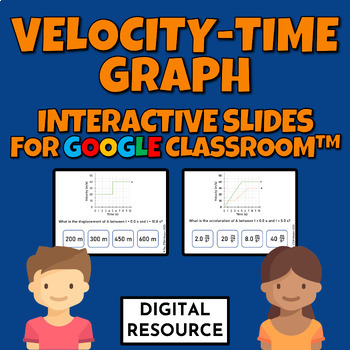
Velocity-Time Graph Interactive Google Slides Game for Google Classroom
Math, Physical science digital interactive Google Slides activity covering velocity-time graphs, acceleration speed, velocity, time, distance, interpreting motion graphs. Digital interactive science task cards for Google Slides, Google Classroom, Digital resource Distance Learning.2 challenges with 10 self-checking multiple-choice questions each❗❗The students use the present mode and click on the correct answer to move to the next problem⚡️⚡️⚡️BIG Bundle of Physics⚡️⚡️⚡️⭐⭐⭐BIG Bundle of Chemistr
Subjects:
Grades:
8th - 11th
Types:
CCSS:
NGSS:
MS-PS2-2
Also included in: Physical Science Chemistry Physics Digital Resource MEGA Bundle
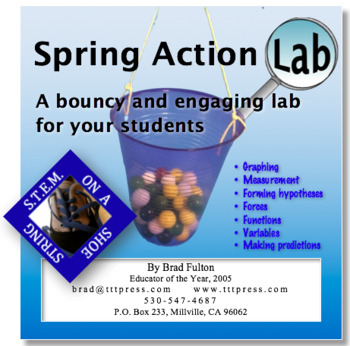
Spring Action Lab: A Bouncy and Engaging STEM Lab
Students will enjoy putting their learning to work in this engaging lab. Using springs or rubber bands, students measure and record data as they try to get a bucket to touch the floor by adding weights. Then they use their data and its graph to make predictions and write equations that will help them predict the outcomes. This simple and inexpensive lab will help your students learn graphing, t-tables, measurement, linear functions, and the physics of tension forces. This can be used as a stand-
Subjects:
Grades:
5th - 9th
Types:
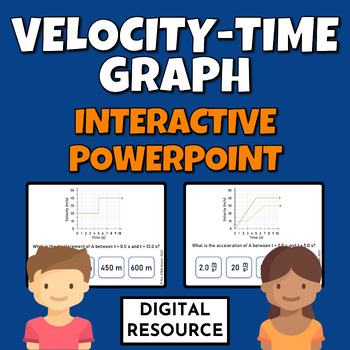
Velocity Time Graph Interactive Powerpoint Digital Resource
Math, Physical science digital interactive PowerPoint activity covering desctibing motion, velocyty-time graphs, speed, velocity, time, distance, interpreting motion graphs. Digital interactive science task cards Digital Resource Distance Learning.2 challenges, 10 multiple choice self-checking problems each❗❗ Instructions: The students go to the first slide and use the slide show mode. A correct answer gives the next problem and incorrect returns to the same problem.Digital product - no prep!✅In
Subjects:
Grades:
8th - 11th
CCSS:
NGSS:
MS-PS2-2
Also included in: Physical Science Interactive PowerPoint BIG Bundle Digital Resource
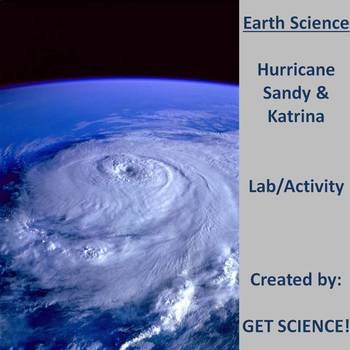
Tracking Hurricane Sandy!
This 6 page lab activity will help students remember where hurricanes form and why. The lab explores the differences and similarities between Hurricane Sandy and Hurricane Katrina. Students will practice their skill of plotting using latitude and longitude as they plot the tracks of both. The Saffir-Simpson scale will be used as students analyze data from both storms. Students will plot pressure vs. wind speed to understand the relationship and answer questions based on the data and general h
Subjects:
Grades:
7th - 12th
Types:
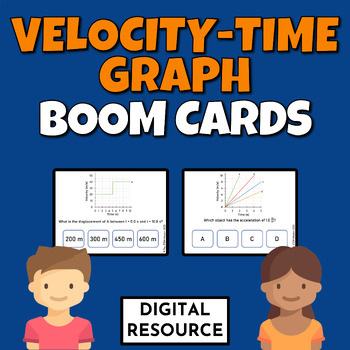
Velocity-Time Graphs Math Science Boom Cards Digital Resource
Math, physical science digital interactive Boom Cards covering velocity-time graphs, acceleration speed, velocity, time, distance, interpreting motion graphs. Digital resource Distance learning.20 cards▶️preview✅Interactive Google Slides version⚡️⚡️⚡️BIG Bundle of Physics⚡️⚡️⚡️⭐⭐⭐BIG Bundle of Chemistry⭐⭐⭐⭐Digital Chemistry Worksheets Bundle✅Physical Science Equation Worksheets Bundle✅Physical Science Graphing Digital Worksheets Bundle for Google Classroom™Common core assessments:✅✅✅Grade 3 Math
Subjects:
Grades:
8th - 11th
Types:
CCSS:
NGSS:
MS-PS2-2
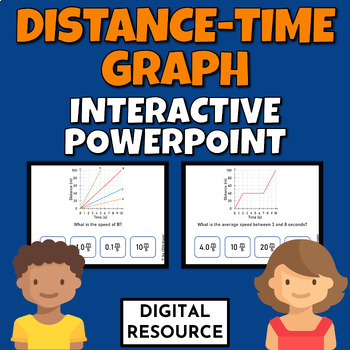
Distance Time Graph Interactive Powerpoint Digital Resource
Math, Physical science digital interactive PowerPoint activity covering desctibing motion, distance-time graphs, speed, velocity, time, distance, interpreting motion graphs. Digital interactive science task cards Digital Resource Distance Learning.2 challenges, 10 multiple choice self-checking problems each❗❗ Instructions: The students go to the first slide and use the slide show mode. A correct answer gives the next problem and incorrect returns to the same problem.Digital product - no prep!✅In
Subjects:
Grades:
6th - 9th
CCSS:
NGSS:
MS-PS2-2
Also included in: Physical Science Interactive PowerPoint BIG Bundle Digital Resource
Scientific Thinking Worksheets
3 fully editable, NGSS/modeling pedagogy aligned worksheets! There are a variety of free response questions for most worksheets, which are usually one or two pages long. Worksheets are used for students to deploy models developed from inquiry labs and as a way to practice problem-solving en route to mastery of learning targets before quizzes and unit tests. WS 1 - Math InventoryGiven a quantity, convert it to an equivalent value in a different unit. Given an equation and known values, substitute
Subjects:
Grades:
7th - 12th
Types:
CCSS:
01 - Scientific Thinking Writing Assignment
Fully editable, NGSS/modeling pedagogy aligned short writing assignment! These short writing assignments are usually one page long and include 3-4 short answer prompts that require students to explain and demonstrate their mastery of different learning targets covered in each unit. There is a rubric embedded at the bottom of each assignment as well for streamlined grading.Learning Targets Assessed:I know...the definition of a dependent variable and an independent variable.the definition of a lin
Subjects:
Grades:
7th - 12th
Types:
Also included in: Conceptual Physics Writing Assignments
Motion Graphs Activity
Students will use toy cars, timer, and ruler to create Distance vs. Time motion graphs. There is also an extension activity that challenges the students to model and graph an event that will show Distance vs. Time graphs can be used to keep people safe.
Subjects:
Grades:
5th - 8th
Types:
01 - Density Lab Summary
Fully editable, NGSS/modeling pedagogy aligned inquiry lab summaries! Most lab summaries consist of 2 pages total, with space for students to provide the following information:Lab investigation purposeData for the independent and dependent variableWritten statement on data trendsSketch of a graphical model using a line of best fitLinear equation to mathematically model the relationship between the variablesAnalysis of physical meanings of slope and y-intercepts Space to list tools used and a bri
Subjects:
Grades:
7th - 12th
Types:
Also included in: Conceptual Physics Inquiry Labs
01 - Marbles Lab Summary
Fully editable, NGSS/modeling pedagogy aligned inquiry lab summaries! Most lab summaries consist of 2 pages total, with space for students to provide the following information:Lab investigation purposeData for the independent and dependent variableWritten statement on data trendsSketch of a graphical model using a line of best fitLinear equation to mathematically model the relationship between the variablesAnalysis of physical meanings of slope and y-intercepts Space to list tools used and a bri
Subjects:
Grades:
7th - 12th
Types:
Also included in: Conceptual Physics Inquiry Labs
![Preview of Calculating and Graphing Freezing Point Depression w/ key [print and digital]](https://ecdn.teacherspayteachers.com/thumbitem/Calculating-and-Graphing-Freezing-Point-Depression-w-key-print-and-digital--8499981-1700072726/original-8499981-1.jpg)
Calculating and Graphing Freezing Point Depression w/ key [print and digital]
This ready to use handout includes a link to a Bite Scized video that deep dives how to calculate and graph freezing point depression and provides practical application with the Frozen Honey TikTok trend.This is the perfect supplemental activity to any unit reviewing how to calculate and graph results from a science lab or experiment. It is any easy print-and-go supplemental lesson (or homework assignment).Included:Standards Aligned questions13 minute video explaining and contextualizing the top
Subjects:
Grades:
8th - 10th
Types:
CCSS:
01 - Linear Relationships Guided Notes
Fully editable, NGSS/modeling pedagogy aligned guided notes! Most guided notes provide in-context examples of concepts that will be heavily referenced and utilized throughout the unit, specifically with deploying the models to demonstrate the phenomenon being investigated. Guided notes include scaffolded diagrams and require students to respond to short-answer prompts.Learning Targets Assessed:I know...the definition of a dependent variable and an independent variable.the definition of a linear
Subjects:
Grades:
7th - 12th
NGSS:
5-PS1-3
, MS-PS1-2
Also included in: Conceptual Physics Entire Curriculum
01 - Scientific Thinking WS 2 (Linear Relationships)
Fully editable, NGSS/modeling pedagogy aligned worksheet! There are a variety of free response questions for most worksheets, which are usually one or two pages long. Worksheets are used for students to deploy models developed from inquiry labs and as a way to practice problem-solving en route to mastery of learning targets before quizzes and unit tests. WS 1 - Math InventoryGiven a quantity, convert it to an equivalent value in a different unit. Given an equation and known values, substitute an
Subjects:
Grades:
7th - 12th
Types:
Also included in: Scientific Thinking Worksheets
01 - Linear Relationships Reading
Fully editable, NGSS/modeling pedagogy aligned reading assignment! Fully editable, NGSS/modeling pedagogy aligned reading assignment! Most reading assignments give an introduction and overview of concepts that will be heavily referenced and utilized throughout the unit, along with an space for students to summarize their learning by completing a fill-in-the-blank summary with a given word bank, or responding to short answer prompts.Learning Targets:I know...the definition of a dependent variable
Subjects:
Grades:
7th - 12th
Types:
Also included in: Conceptual Physics Entire Curriculum
01 - Scientific Thinking Quiz 1
Fully editable, NGSS/modeling pedagogy aligned quiz! There is a mix of free-response and multiple-choice questions for most quizzes, which are usually one or two pages long. Quizzes are used for students to demonstrate proficiency of learning targets outlined in the corresponding curriculum guide by deployIng models developed from inquiry labs and utilized in problem-solving on worksheets. Quizzes are a good way for students to gauge their level of mastery to indicate how to study for unit tests
Subjects:
Grades:
7th - 12th
Types:
Also included in: Conceptual Physics Quizzes
01 - Scientific Thinking Quiz 2
Fully editable, NGSS/modeling pedagogy aligned quiz! There is a mix of free-response and multiple-choice questions for most quizzes, which are usually one or two pages long. Quizzes are used for students to demonstrate proficiency of learning targets outlined in the corresponding curriculum guide by deployIng models developed from inquiry labs and utilized in problem-solving on worksheets. Quizzes are a good way for students to gauge their level of mastery to indicate how to study for unit tests
Subjects:
Grades:
7th - 12th
Types:
NGSS:
5-PS1-3
, MS-PS1-2
Also included in: Conceptual Physics Quizzes
Showing 1-24 of 31 results

