5 results
Earth sciences Common Core 8.F.B.5 resources
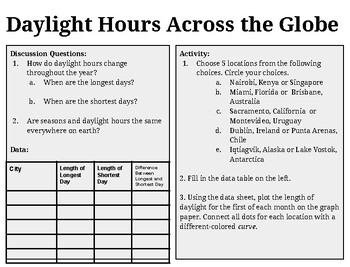
Daylight Hours Across the Globe
There are many aspects of the Earth-Sun-Moon cycle that can be difficult for students to visualize. Included among these are how daylight changes depending on latitude. This activity intends to provide students with actual data from different locations on Earth at different latitudes that can provide an obvious visual demonstrating this scientific fact. Included in this assignment is a map of the Earth with major latitude lines, daylight data for 8 locations, latitude data for both northern and
Grades:
6th - 8th
Types:
CCSS:
NGSS:
MS-ESS1-1
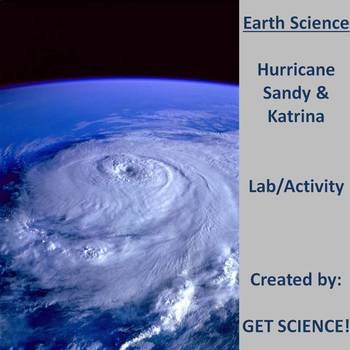
Tracking Hurricane Sandy!
This 6 page lab activity will help students remember where hurricanes form and why. The lab explores the differences and similarities between Hurricane Sandy and Hurricane Katrina. Students will practice their skill of plotting using latitude and longitude as they plot the tracks of both. The Saffir-Simpson scale will be used as students analyze data from both storms. Students will plot pressure vs. wind speed to understand the relationship and answer questions based on the data and general h
Subjects:
Grades:
7th - 12th
Types:
Human Population Graphing Lab
This simple yet effective lab allows students to strengthen their graphing skills using real word data. Students will deal with larger numbers as they see the exponential growth of the global population.Students will practice rate of change problems and scientific notation. Students will also make observations and inferences on their findings.You may edit this lab. Answer key and Graph Paper provided. Website for current world population in real time provided.Educating the World Together!
Subjects:
Grades:
6th - 12th
Types:

Apollo 13 interactive movie worksheet
This interactive movie worksheet is designed to engage students as they watch the film Apollo 13. The worksheet consists of short answer, fill-in-the-blanks and open-ended questions related to Astronomy, and historical context of the movie. Students will receive immediate feedback on their responses, and teachers can easily review and grade their work using the Classkick platform. Kindly provide me with your email address, and I will promptly send you an interactive version suitable for use wi
Subjects:
Grades:
7th - 10th
Types:
NGSS:
MS-ESS1-2
, MS-ESS1-3
, MS-ESS1-1
Science & Math | Rising Temperature Lesson | Graphing | Free
In this lesson, students choose temperature data to graph in order to explore the relationship between maximum and minimum New Jersey temperatures over time.Step 1 - Inquire: Students interact with two data tables showing maximum and minimum average temperatures in New Jersey.Step 2 - Investigate: Students choose data to graph both max and min temperatures over time and discuss their findings.Step 3 - Inspire: Students watch a video showing the current effects of temperature in New Jersey and ex
Subjects:
Grades:
6th - 8th
Types:
NGSS:
MS-ESS3-5
Showing 1-5 of 5 results

