291 results
High school statistics interactive whiteboards for homeschool
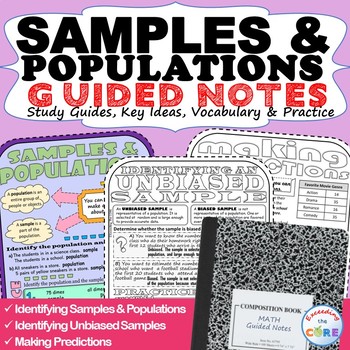
SAMPLES & POPULATIONS Doodle Math - Interactive Notebooks (Guided Notes)
- Great for online learning and distance learning!Have your students use these SAMPLES & POPULATIONS Guided Notes to review key ideas and essential vocabulary . Guided Notes aid in student focus, concept retention, engagement and creativity. Using this resource will allow students to synthesize this math concept and create their own tangible connections in their notes. Guided Notes Includes:__ Key Ideas with Verbal & Numerical Examples__ Essential Vocabulary with Definitions__ Skills Pr
Subjects:
Grades:
6th - 8th
Also included in: 7th GRADE MATH Assessments, Warm-Ups, Task Cards, Worksheets BUNDLE
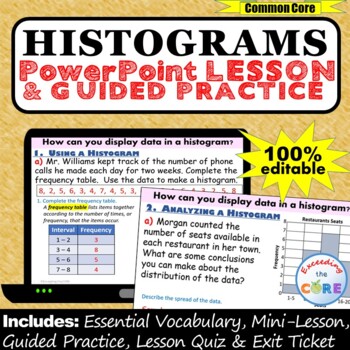
HISTOGRAMS and FREQUENCY TABLES PowerPoint Lesson AND Guided Practice - DIGITAL
Great for online learning and distance learning!Get your students successfully creating and using HISTOGRAMS and Frequency Tables with this PowerPoint Presentation. This lesson begins with a focused mini-lesson and guided practice questions. It concludes with a lesson quiz and exit ticket to assess student understanding. All of the answers are included. This PowerPoint presentation is 100% editable, therefore you can modify any slide as needed.What is Included:_ Mini-Lesson with Guided Practice
Subjects:
Grades:
6th - 8th
CCSS:
Introduction to Probability and Statistics Lesson Plan Bundle
Elementary Statistics - Introduction to Probability and Statistics Lesson Plan BundleThis bundle includes:-Introduction to Statistics and Types of Data-Data Collection, Sampling Techniques, and Studies-Introduction to Technology in Statistics Activity-Organizing Data Using Frequency Distributions-Histograms and Dot Plots-Graphs and Charts in Statistics-Organizing and Presenting Data Using Technology Activity-Measures of Central Tendency-Measures of Position-Measures of Variation-Introduction to
Subjects:
Grades:
10th - 12th, Higher Education
Confidence Intervals and Hypothesis Testing Lesson Plan Bundle
Elementary Statistics - Confidence Intervals and Hypothesis Testing Lesson Plan BundleThis bundle includes:-Confidence Intervals for the Mean-Confidence Intervals for Proportions-Confidence Intervals for Variance and Standard Deviation-Introduction to Hypothesis Testing-Hypothesis Testing for the Mean-Hypothesis Testing for Proportions-Hypothesis Testing forVariance and Standard Deviations-Other Uses of Hypothesis Testing-Confidence Intervals and Hypothesis Testing Test-Confidence Intervals and
Subjects:
Grades:
10th - 12th, Higher Education
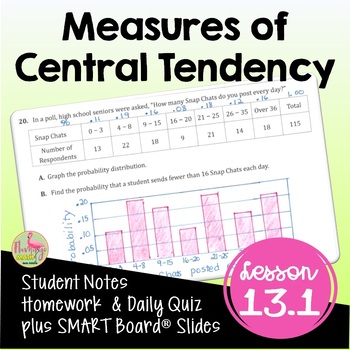
Measures of Central Tendency (Algebra 2 - Unit 13)
Measures of Central Tendency Algebra 2 Lesson:Your Pre-AP Algebra 2 Honors students will draw, analyze and interpret box-and-whisker plots, find outliers, and calculate measures of central tendency in this unit 13 lesson on Data Analysis & Statistics that cover the concepts in depth. #distancelearningtptWhat is included in this resource?⭐ Guided Student Notes⭐ Google Slides®⭐ Fully-editable SMART Board® Slides⭐ Homework/Practice assignment⭐ Lesson Warm-Up (or exit ticket)⭐Daily Content Quiz
Subjects:
Grades:
8th - 11th, Higher Education
CCSS:
Also included in: Algebra 2 Curriculum Mega Bundle | Flamingo Math
6th Grade Statistics & Data 5 - Box and Whisker Plot Powerpoint Lesson
Sixth Grade Statistics 5 - Box and Whisker Plot Powerpoint Lesson is powerful when used as direct instruction in the classroom, online or individually. It teaches students all the skills necessary to make a box and whisker plot: mean, median, lower quartile Q1, upper quartile Q3, inter quartile range, range, minimum and maximum numbers. Students then are shown how to take this information and build a box and whisker plot. Finally, students are taught how to analyze the box and whisker plot th
Subjects:
Grades:
6th, Adult Education
Also included in: 6th Grade Statistics & Data Bundle - 6 Powerpoint Lessons - 402 Slides
Probability and Counting Rules Lesson Plan Bundle
Elementary Statistics - Probability and Counting Rules Lesson Plan BundleThis bundle includes:-Introduction to Probability-Addition Rules for Probability-Multiplication Rules and Conditional Probability-Notation and Symbols in Probability-Permutations and Combinations-Application of Counting Rules-Probability and Counting Rules Test-Probability and Counting Rules Quiz (Bonus File)-Sample Space Handout (Bonus File)-Pacing Guide (Bonus File)Preview: Please refer to the above links for additional p
Subjects:
Grades:
10th - 12th, Higher Education
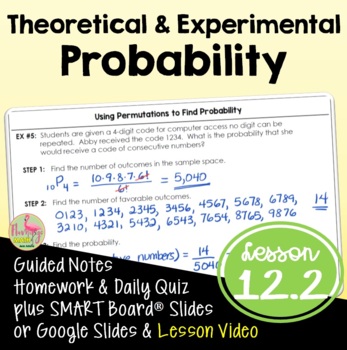
Theoretical and Experimental Probability (Algebra 2 - Unit 12)
Theoretical & Experimental Probability Algebra 2 Lesson:Your Pre-AP Algebra 2 Honors students will find both experimental and theoretical probabilities in this Unit 12 lesson. #distancelearningtptWhat is included in this resource?⭐ Guided Student Notes⭐ Google Slides®⭐ Fully-editable SMART Board® Slides⭐ Homework/Practice assignment⭐ Lesson Warm-Up (or exit ticket)⭐ Daily Content Quiz (homework check)⭐ Video Lesson Link for Distance Learning - Flipped Classroom models⭐ Full solution setStude
Subjects:
Grades:
8th - 11th, Higher Education
CCSS:
Also included in: Algebra 2 Curriculum Mega Bundle | Flamingo Math
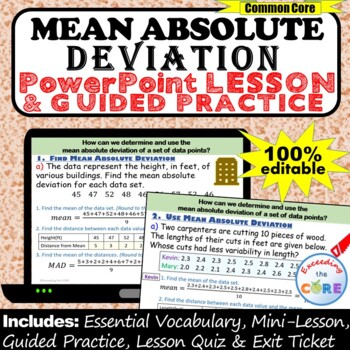
MEAN ABSOLUTE DEVIATION (MAD) PowerPoint Lesson & Practice | Distance Learning
Great for online learning and distance learning!Get your students successfully finding the MEAN ABSOLUTE DEVIATION (MAD) with this PowerPoint Presentation. This lesson begins with a focused mini-lesson and guided practice questions. It concludes with a lesson quiz and exit ticket to assess student understanding. All of the answers are included. This PowerPoint presentation is 100% editable, therefore you can modify any slide as needed.What is Included:_ Mini-Lesson with Guided PracticeThe mini-
Subjects:
Grades:
5th - 7th
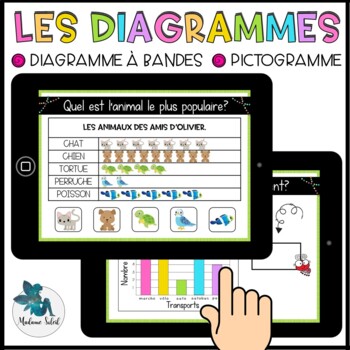
Les diagrammes au 1er cycle Boom Cards French distance learning
French pictograph, french graph. Activité mathématique de statistique permettant de travailler le diagramme, les diagrammes, le pictogramme, les graphiques, l'histogramme ou le diagramme à bande pour des élèves de 1re année, 2e année et 3e année. Super en groupe, en atelier, dans les centres mathématiques, à distance et à la maison. French immersion.Viens l'essayer avant de l'acheter !C'est quoi?20 Cartes Boom dans lesquelles les élèves doivent :- Analyser les diagrammes.- Répondre à la question
Subjects:
Grades:
1st - 3rd
Also included in: Bundle 1re année mai mathématique BOOM CARDS French distance learning
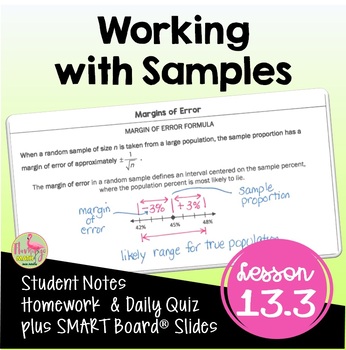
Working with Samples (Algebra 2 - Unit 13)
Working with Samples Algebra 2 Lesson:Your Pre-AP Algebra 2 Honors students will find draw, analyze and interpret box-and-whisker plots, find outliers, and calculate measures of central tendency in this unit 13 lesson on Data Analysis & Statistics that cover the concepts in depth. #distancelearningtptWhat is included in this resource?⭐ Guided Student Notes⭐ Google Slides®⭐ Fully-editable SMART Board® Slides⭐ Homework/Practice assignment⭐ Lesson Warm-Up (or exit ticket)⭐Daily Content Quiz (ho
Subjects:
Grades:
8th - 11th, Higher Education
CCSS:
Also included in: Algebra 2 Curriculum Mega Bundle | Flamingo Math
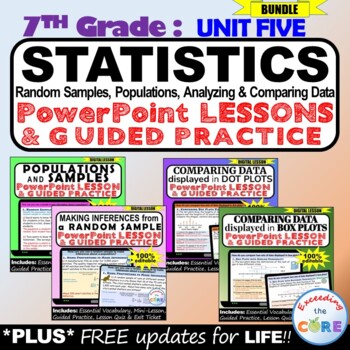
STATISTICS: 7th Grade PowerPoint Lessons DIGITAL BUNDLE
- Great for online learning and distance learning!Get your students to successfully understand the 7th Grade STATISTICS UNIT (random samples and populations, making inferences, analyzing and comparing data ) with this PowerPoint Presentation BUNDLE.This bundle includes 4 PowerPoint Lessons that are designed to teach students how to use samples to gain information about a population. Students will also be able to compare and analyze data in dot plots and box plots.These lessons cover the entire
Subjects:
Grades:
6th - 8th
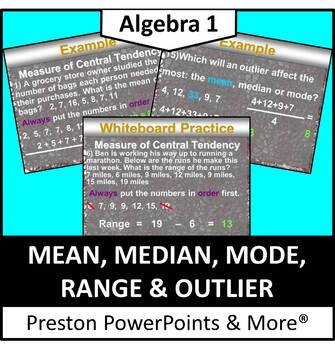
Mean, Median, Mode, Range and Outlier in a PowerPoint Presentation
Mean, Median, Mode, Range and Outlier in a PowerPoint PresentationThis slideshow lesson is very animated with a flow-through technique. It was made for my Algebra 1 class, but can be used for lower grades aw well. The lesson teaches how to solve for mean, median, mode and range. It also teaches to identify outliers in a set of data and find the measure of central tendency.NEW: The lesson is in an editable format so you can tailor the lesson to your class. The problems and clipart can’t be edit
Subjects:
Grades:
6th - 10th
6th Grade Statistics & Data 1 - Statistical Questions & Types of Data Lesson
Sixth Grade Statistics 1 - Statistical Questions and Types of Data Powerpoint Lesson is powerful when used as direct instruction in the classroom, online, or individually. It teaches students how to recognize and pose a statistical question. Students also learn the difference between numerical and categorical data. They also learn the 4 basic steps in presenting data: posing a statistical question, gathering the data, displaying the data, and answering the question they posed. There are 22
Subjects:
Grades:
6th, Adult Education
CCSS:
Also included in: 6th Grade Statistics & Data Bundle - 6 Powerpoint Lessons - 402 Slides
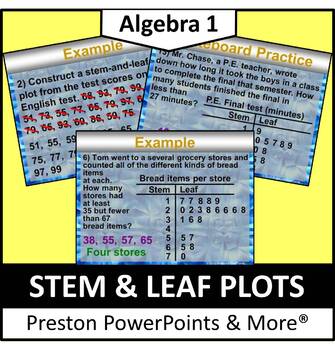
Stem and Leaf Plots in a PowerPoint Presentation
Stem and Leaf Plots in a PowerPoint PresentationThis slideshow lesson is very animated with a flow-through technique. I developed it for my Algebra 1 class, but it can be used for lower grades as well. This lesson was one of a chapter that was used as a review for all previous grades. The lesson teaches how to interpret data from the stem-and-leaf plot and make and use a stem-and-leaf plot to put data in order.NEW: The lesson is in an editable format so you can tailor the lesson to your class.
Subjects:
Grades:
6th - 9th
CCSS:
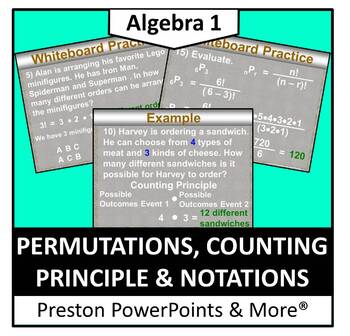
Permutations, Counting Principle and Notations in a PowerPoint
Permutations, Counting Principle and Notations in a PowerPoint PresentationThis slideshow lesson is very animated with a flow-through technique. I developed the lesson for my Algebra 1 class, but it can also be used for upper level class reviews. This lesson teaches how to find the total number of permutations, solve a combination problem, solve permutations and combination problem in notation form.NEW: The lesson is in an editable format so you can tailor the lesson to your class. The problem
Subjects:
Grades:
8th - 11th
CCSS:
Distributions of Data Lesson Plan Bundle
Elementary Statistics - Distributions of Data Lesson Plan BundleThis bundle includes:-Introduction to Probability Distributions-Mean and Standard Deviation of Probability Distributions-Binomial Distributions-The Normal Distribution-Find Z-Scores for Normal Distributions-Applications of Normal Distribution-Central Limit Theorem-Distributions of Data Test-Normal Distribution Table-Distributions of Data Quiz (Bonus File)-Pacing Guide (Bonus File)Preview: Please refer to the above links for addition
Subjects:
Grades:
10th - 12th, Higher Education
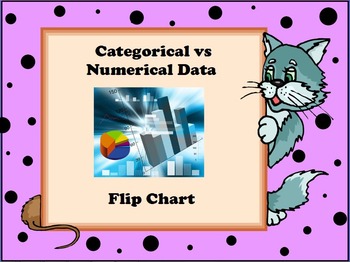
Categorical Data vs Numerical Data Flip Chart
In this flip chart, students will learn the difference between categorical data and numerical data, examples, and key vocabulary. The activinspire flip chart allows the teacher to reveal the information by removing the shapes over the correct information. At the end of the lesson are five questions which the students have to classify as categorical or numerical.
Grades:
5th - 8th
Types:
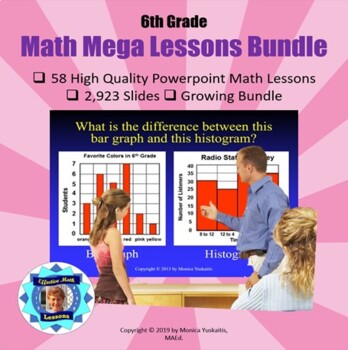
6th Grade Powerpoint Mega Math Bundle - 58 Lessons - 2923 Slides
Sixth Grade Powerpoint Math Bundle is composed of 58 different high quality math powerpoint lessons comprising 2,923 slides. These are perfect for distance learning on Zoom or similar formats. On top of that they are powerful when used as direct instruction in the classroom.There are 22 strategies of effective teaching based on research in these powerpoint lessons. . For further information on each lesson click on them individually. This is a growing bundle which means as new products are a
Subjects:
Grades:
6th, Adult Education
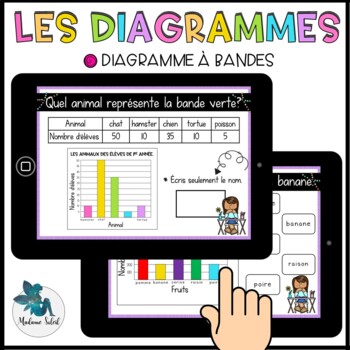
Les diagrammes à bandes en 2e année Boom Cards
French graph. Activité mathématique de statistique et d'enquête permettant de travailler le diagramme, l'histogramme ou le diagramme à bande pour des élèves de 2e année et 3e année. Super en atelier de math, dans les centres mathématiques, à distance et à la maison. Viens l'essayer avant de l'acheter !C'est quoi?20 Cartes Boom dans lesquelles les élèves doivent :- Analyser les diagrammes.- Répondre à la question.DescriptionC'est une activité auto-correctrice avec laquelle l'enfant reçoit une rét
Subjects:
Grades:
2nd - 3rd
Also included in: Bundle 2e année mars mathématique Boom Cards
Statistics and Probability PowerPoint Presentation: 6.SP.1-5
This product contains 13 instructional slides related to concepts about statistics and probability in a PowerPoint presentation. The PowerPoint correlates to the "foldables" and posters in my other CCSS 6.SP products. It is just formatted differently, but the content is the same.NOTE: This product is also a part of my Complete Packaged Unit (All practice sheets, foldables, PowerPoint, Posters, Assessments, and Task Cards)!Visit Suzanne's Classroom Store! The resources are designed to enrich o
Subjects:
Grades:
5th - 7th
Also included in: Statistics and Probability: CCSS 6.SP.1-5 Bundle

Statistics animated powerpoint lesson template
Content:1.Introduction2.Discrete Data3.Continuous Data4.Central Tendancy of a Data Set5.Range and Interquartile Range6.Box and Whisker Plot
Subjects:
Grades:
8th - 9th
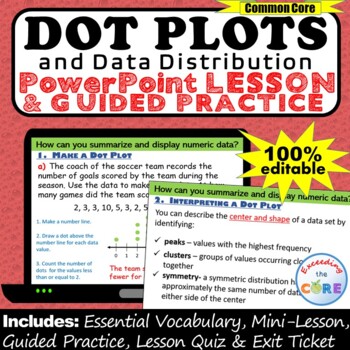
DOT PLOTS, LINE PLOTS & DATA DISTRIBUTION PowerPoint Lesson & Practice | Digital
Great for online learning and distance learning!Get your students successfully creating and using DOT PLOTS /LINE PLOTS and Data Distribution with this PowerPoint Presentation. This lesson begins with a focused mini-lesson and guided practice questions. It concludes with a lesson quiz and exit ticket to assess student understanding. All of the answers are included. This PowerPoint presentation is 100% editable, therefore you can modify any slide as needed.What is Included:_ Mini-Lesson with Gui
Subjects:
Grades:
6th - 8th
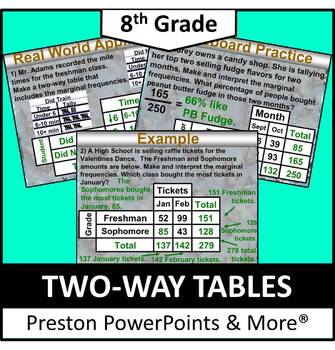
(8th) Two-Way Tables in a PowerPoint Presentation
8th Grade Math (Pre-Algebra) Two-Way Tables in a PowerPoint PresentationThis slideshow lesson is very animated with a flow-through technique. I developed the lesson for my 8th grade class, but it can also be used for upper level class reviews. This lesson teaches how to read two-way tables, make and interpret two-way tables, and use graphs to organize and solve real-life data problems, such as the most liked movie genre.This lesson has SKELETON NOTES, notes that have the problem only. I used t
Subjects:
Grades:
7th - 9th
CCSS:
Showing 1-24 of 291 results


