180 results
High school statistics resources for Microsoft Excel and for early intervention
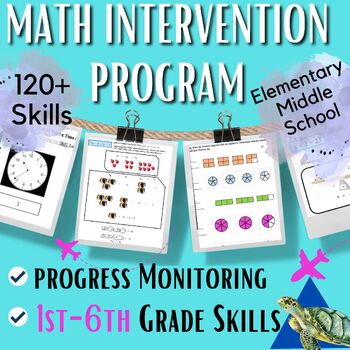
Math Intervention Program SPED & RTI progress monitoring Elem, Middle, High
Traveling Mathematics is a math intervention program that identifies and targets 120+ skills from 1st grade to middle of 6th grade. This math intervention binder includes progress monitoring, data tracking charts, teaching models, and practice pages to close gaps with special education, RTI (Tier 2 and 3), MTSS, and math classrooms. You will benefit from being able to QUICKLY identify skills to target and record all data in a snapshot. All data is logged on an (editable) excel spreadsheet per gr
Subjects:
Grades:
2nd - 10th
Types:
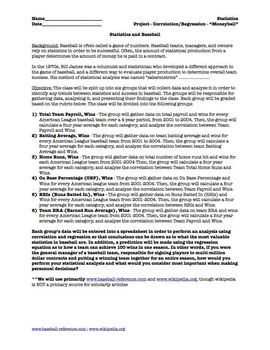
Statistics Correlation and Regression Project for Movie "Moneyball" (5 day)
Prerequisite: Correlation and Regression (Linear). This is a project that divides a statistics class into 6 groups and students do ACTUAL data collection from given websites and they perform their OWN ANALYSIS. They will use computers/internet/excel/spreadsheets/graphing calculators to evaluate correlation. If you have interest in baseball and statistics, this is a great project to get the class interested, and covers about 5 days, plus you can watch the movie "Moneyball" afterwards as a reward.
Subjects:
Grades:
10th - 12th, Higher Education, Adult Education
Types:
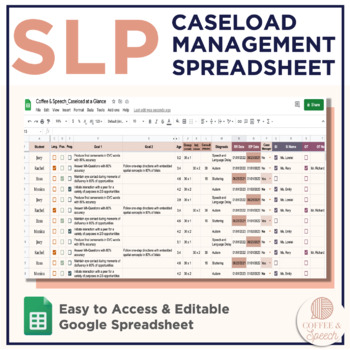
SLP Ultimate Caseload Management Spreadsheet | Caseload-At-A-Glance
SLPs have ever-growing caseloads! It is difficult to keep track of IEPs, RRs, make-up time, team members... This ULTIMATE CASELOAD MANAGEMENT SPREADSHEET will help you stay organized and have all the important information about your students in one place!The Caseload-At-A-Glance Spreadsheet includes:- Pre-written formulas to help you calculate age (Y;M)- Checklist style variables that allow you to easily filter by information- Each student's row can track: ⋒ Goals ⋒ Type of Tx (e.g., Articulatio
Grades:
PreK - 12th, Staff
Types:

IEP Time Data Sheet -SPED / AUTISM Tool- Track Wanted/Unwanted Behaviors
EDITABLE, BEAUTIFUL, and EASY TO USE over and over for IEP's, Special Education, and/or classroom data tracking. You enter the time data and the rest is done for you automatically. Simply record the amount of time a student spends on wanted or unwanted behaviors and the sheet will then automatically: total percentages and create a graph.This Data Collection Tool works great for tracking any behavior related to time. For example a student with autism interacting at recess; how much time any child
Grades:
PreK - 12th, Adult Education
12 Days of Christmas: A Computer Spreadsheet Activity
This great holiday activity shows students how to use a computer spreadsheet to calculate the cost of their true love's gifts in today's dollars.The simple step-by-step procedure will allow both beginning and computer-savvy students to experience success as they learn how to use spreadsheet software. Students will enjoy the engaging and entertaining activity. No computer? No problem! Use the activity master so students can calculate the costs themselves.
Grades:
5th - 9th
Types:
School Counselor Data Tracker- ASCA model!
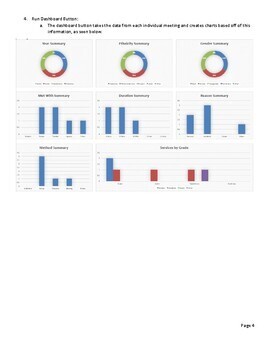
Now with fully editable categories and headings! (Adjust grade levels, reason for visit, method of visit, etc).This is a program, created in excel, that tracks school counselor's meeting data and produces an easy to read excel doc as well as a dashboard of statistics.See the user guide (preview file) of how the program works and all that it does. Tracks visits with student, teacher, parent etc and services in the ASCA model. Compatible with Windows & IOS!Note: When updating the settings, can
Grades:
PreK - 12th, Higher Education, Adult Education, Staff
SIPPS Data Collection Sheets
Great way to organize your data for classroom, specialists, school, or district. Streamline data by class or school Mastery Assessments for all levelsBeginning Extension Plus ChallengeColor coded to match SIPPS levels Mastery Assessments for all levelsBeginning Extension Plus Challenge Use this data to create SIPPS Intervention and Mastery Test Documentation for All Levels --Beginning, Extension, Plus and Challenge. Groups of students can be followed for regrouping purposes and progress monitori
Subjects:
Grades:
K - 12th
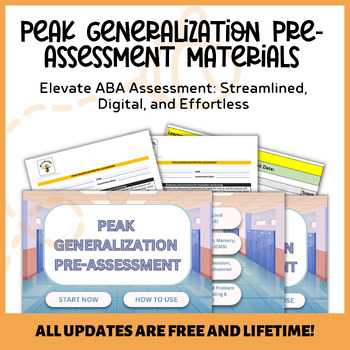
PEAK Generalization Pre-Assessment Materials with Script and Scoring Guide
Introducing the PEAK Generalization Pre-Assessment, now available in a user-friendly digital format, designed with your needs in mind for ABA therapy. This comprehensive package covers a wide range of assessments, including Foundational Learning, Basic Social Skills, Basic Verbal Comprehension, Memory, Advanced Social Skills, Advanced Verbal Comprehension, Basic Problem Solving, and Advanced Math Skills.Our program includes essential tools like an assessor script and a scoring guide, convenientl
Grades:
PreK - 12th
Progress Monitoring Data Collection UPDATED 1-2-2017
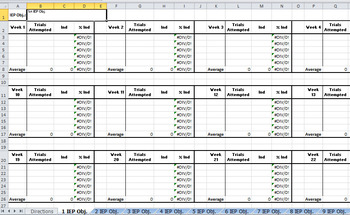
Use this excel spreadsheet to monitor student progress. Monitor up to 10 goals in one spreadsheet. Includes a directions page to show you how to setup your progress monitoring spreadsheet. All you need to do is enter the raw data, then the spreadsheet will calculate the percentage, graph the data, and enter the percentages onto a nine weeks sheet. It is great for showing parents the progress their child is making. It is also great to guide your lessons.
UPDATED 1/2/2017:
Fixed graphing gliches
Grades:
PreK - 12th
Types:
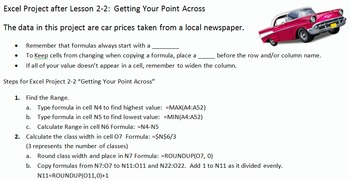
Excel Projects for Statistics Frequency Distributions and Charts
This file contains three different projects with solutions and a quick reference card for students. It correlates to Bluman's Elementary Statistics textbook.
First is an Introduction to Excel. There is an example, guided practice and then 4 Projects. The instructions are on each sheet. The topics covered are: basic editing and formatting, beginning charts, beginning formulas, such as SUM and AVERAGE, and calculations. There is an editable grading rubric for this project. The Preview file
Subjects:
Grades:
8th - 11th, Higher Education, Adult Education
Types:
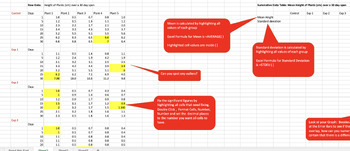
Bundle - Help with Science Fair Table, Graphs, Statistics using Excel.
This comprehensive 3-part bundle comprises a video tutorial, an informative handout, and an Excel file meticulously guiding students through a step-by-step process. The aim is to empower students with the skills to transform raw data into concise summative data tables and graphs, complete with standard deviation error bars. The tutorial covers the entire spectrum – from utilizing Excel for table and graph preparation to conducting statistical analyses using Anova tests, t-tests, or correlation m
Subjects:
Grades:
9th - 12th
Types:
Statistics Unit 9 Bundle - Hypothesis Testing (one sample) (18 days)
This is a unit plan bundle for a Statistics class. The plans include common core math standards, time frame, activities, enduring understandings, essential questions, and resources used. It is designed to last 18 days, depending on pacing. The plans include: 56-slide presentation, with annotated guide for reference5 Worksheets1 "Read & Respond" Article Worksheet2 Quizzes"Do Now" Entrance problemsSpreadsheet Activity - Hypothesis TestingReview slides (for peer presentations)Unit ReviewUnit Te
Subjects:
Grades:
10th - 12th, Higher Education
Types:
CCSS:
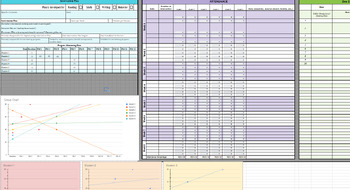
MTSS Intervention Tracking Sheet Tier 2 and 3
This sheet is a great way to keep track of student data such as progress monitoring, attendance, and notes from meetings about each group. It also provides a group graph based on your input of data and individual student graphs. This makes it easy to see who is not growing at the same rate as others. I am a MTSS lead at my school and created this to use and other schools in the district has used it as well as professors from the local university in their teacher prep program.
Subjects:
Grades:
PreK - 12th, Staff
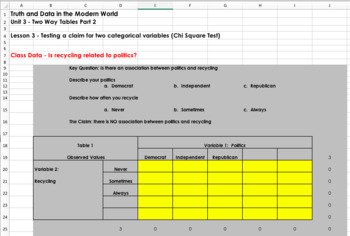
Teaching Statistics with Spreadsheets (Self Grading)
You can see a video that describes the basics of this course at the following link: https://www.youtube.com/watch?v=uZFpltXWyw8This package is an entire statistics course designed for content to be delivered, taught, practiced, and assessed through spreadsheets. Students learn basic statistics and spreadsheet skills. This course is intended to allow for student collaboration and group work throughout the learning process. Each spreadsheet is automatically graded so students can see their progres
Grades:
9th - 12th
Types:

VM Numeracy Unit 2 - Civics - Data and Uncertainty
VCE VM Unit 2 Numeracy book, Civic - Data and Uncertainty. This unit looks at odds, reading and interpreting data, probability and statistics. Includes many hands-on activities.
Subjects:
Grades:
10th - 12th
Types:
Also included in: Bundle 1
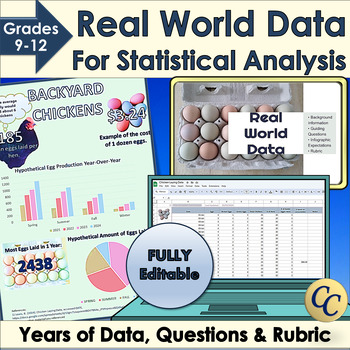
Real World Data for Statistical Analysis and Infographic Project
Give your students access to real world data for your statistical analysis unit or data literacy! Dive into statistics with Microsoft Excel™ or Google Sheets™ and years of data. Learn how to use standard deviation, mean or median to interpret data. Choose the best graphs to display conclusions in an infographic. Works great for science fairs! ✔ Includes an infographic project! (Template, expectations, and rubric). ✔ Everything is fully editable and you and your students can even use the images
Grades:
9th - 12th
Types:
CCSS:
Statistics Unit 8 Bundle - Confidence Intervals (19 days)
This is a unit plan bundle for a Statistics class. The plans include common core math standards, time frame, activities, enduring understandings, essential questions, and resources used. It is designed to last 19 days, depending on pacing. The plans include: 52-slide presentation, with annotated guide for reference5 Worksheets3 Quizzes"Do Now" Entrance problemsSpreadsheet Activity - T-DistributionReview slides (for review response system)Unit test (with review packet)Unit Project - Gather Data,
Subjects:
Grades:
10th - 12th, Higher Education
Types:
CCSS:
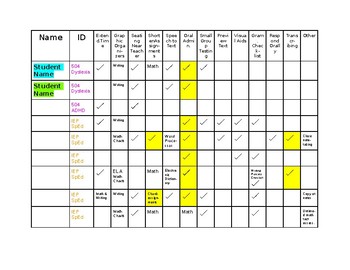
Accommodations "Cheat Sheet"
Take the information from your students' 504s and IEPs, and fill them in on this editable table to have on hand! You can also convert it to a Google Doc and share it with specials teachers or any other teachers that work with your kiddos.
Grades:
PreK - 12th
Intervention Coach Workbook - 11 Customizable Spreadsheets
✴️Establish CONSISTENT, TRANSPARENT procedures for your school-wide intervention system!✴️⛓ Find us on Linktr.ee @MorganLearning ⛓⭐ Companion Links ⭐⚙️ Video Preview: COMING SOON!⚙️ Tutorial Video: YouTube✍️ Blog Post: Morgan Learning Blog⭐ School-wide Intervention Systems & Tools ⭐ ✍️ School Wide Intervention Schedule✍️ Student Assistance Team (Intervention Team) Meeting Record✍️ Class & School-Wide Behavior Benchmarking System✍️ Data Analysis & Intervention Scheduling Plan ✍️ Schoo
Grades:
PreK - 12th, Staff
Types:
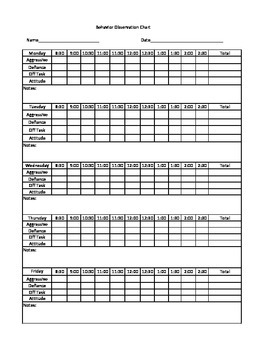
Behavior Monitoring Chart
This is an excel chart (Sorry there is no beautiful cover page) to monitor behavior. I have included the 4 most commonly monitored behaviors. Defiance, Off Task, Aggression, and Attitude.
Use tally marks to count how many times a day the behavior is acted out. Use this for IEP Meetings, RTI meetings, students transitioning in from ESE classroom setting to General Education, and for classroom data.
The behavior specialist will appreciate any data that you have recorded as well.
Grades:
PreK - 12th
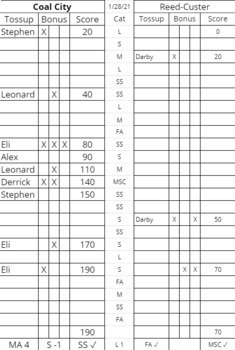
Quiz Bowl/ Scholastic Bowl adaptive stat sheet
DISCLAIMER: Made for IHSA-Compliant Scholastic Bowl. 24 questions per round, 10 point toss-ups, 3 part bonus (each bonus worth 10 points).This is a stat sheet for Scholastic Bowl/ Quiz Bowl practices and games. It adapts in real-time to update the scoreboard and team totals when a name and category abbreviation is applied (see thumbnails for example) The sheet tracks math, science, social studies/history, literature, fine arts, and miscellaneous questions. It is incredibly useful and semi-autono
Subjects:
Grades:
9th - 12th
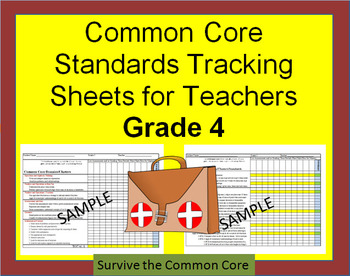
Tracking Sheets (EDITABLE) Common Core 4th Grade Math by Domain/Cluster/Standard
Fourth Grade Common Core Math Standards tracking sheets include the domains of: Operations and Algebraic Thinking, Number and Operations in Base Ten, Number and Operations-Fractions, Measurement and Data, Geometry, and Mathematical Practices.
These tracking sheets are specifically for the 4th grade Math Common Core Standards but can be created for other grade levels. See contact information below. Current tracking sheets exist for the following:
1st Grade Common Core Math Tracking Sheets
2n
Grades:
PreK - 12th
Types:
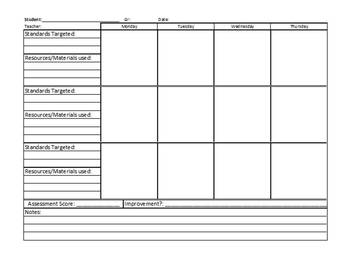
Intervention Progress Monitoring Chart
This is a progress monitoring template that can be used to document interventions of all levels for individual students. I have used it in the past for Special Education IEP monitoring, Tier II Intervention Progress Monitoring, and in class Tier I progress monitoring. There are spaces for you to list the Standards that you are covering in your minilessons/interventions, as well as spaces for you to list the materials or resources that you have used. Each day, you can put your antecdotal notes to
Grades:
PreK - 12th
Types:
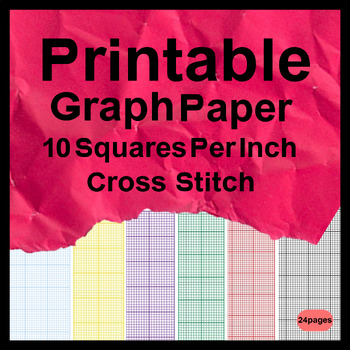
Printable Graph Paper 10 Squares Per Inch Cross Stitch
Printable Graph Paper 10 Squares Per Inch Cross Stitch - Grid paper is essentially the type of paper most commonly used for drawing and sketching purposes. It is widely used for making plan charts, designing websites, developing home ideas and so forth. A great deal of businesses who need to produce a company card, business brochures, catalogues, brochures, and so forth need this kind of graph paper.
Subjects:
Grades:
5th - 12th
Showing 1-24 of 180 results

