42 results
7th grade statistics printables for Easel Activities
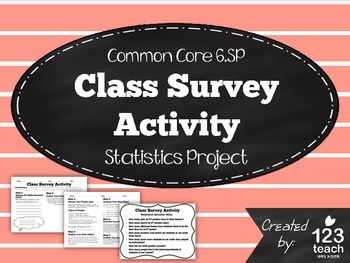
Class Survey Activity - Common Core 6th Grade Statistics Project
This "Class Survey Activity" includes a two page activity aligned to common core standards for statistics and probability (6.SP).
Students will have to come up with a statistical question to survey their classmates. Then, the students will record their results, create a graph, and analyze their data. Lastly, the students will present their results with the class. With my class, I give the students at least a full class period to complete the activity, and then it takes another class perio
Subjects:
Grades:
5th - 7th
Types:
Also included in: Math Assessments and Review Activities BUNDLE for 6th Grade Common Core
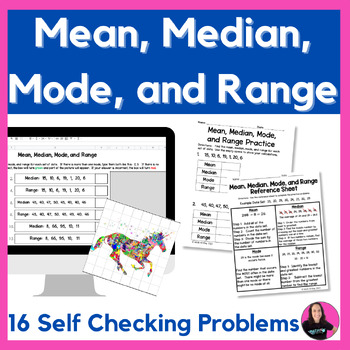
Measures of Central Tendency - Mean, Median, Mode, and Range Activity
In this 6th grade math resource, students will practice finding the mean, median, mode, and range. They will calculate the measures of central tendency with 16 problems, using four different sets of data. This activity is digital and printable. One of the printable pages is a reference sheet, which gives an example set of data and how to find the mean, median, mode, and range.For the digital activity, students will love watching the mystery picture reveal itself as more and more questions ar
Subjects:
Grades:
5th - 7th
Types:
CCSS:
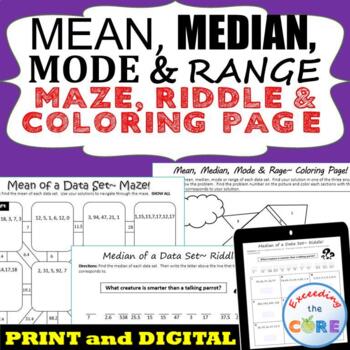
MEAN, MEDIAN, MODE, & RANGE Mazes, Riddles & Coloring Page | Print and Digital
Have your students apply their understanding of finding the MEAN, MEDIAN, MODE, & RANGE of data sets with these fun activities including a maze, riddle and coloring activity. What is Included:1. Finding the Mean MAZEThis is a self-checking worksheet that allows students to strengthen their understanding of finding the mean of positive whole numbers. Students use their answers to navigate through the puzzle.2. Finding the Median RIDDLEStudents find the median of positive whole numbers and use
Subjects:
Grades:
5th - 7th
Types:
Also included in: 6th Grade Math Assessments, Notes, Task Cards, Worksheets BUNDLE
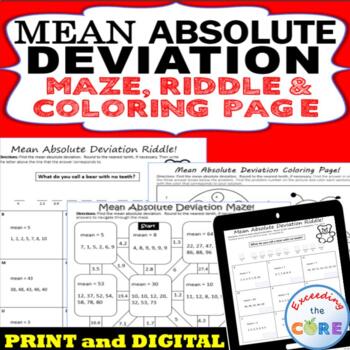
MEAN ABSOLUTE DEVIATION Mazes, Riddles & Coloring Page | Print and Digital
Have your students apply their understanding MEAN ABSOLUTE DEVIATION with these fun activities including a maze, riddle and coloring activity.What's Included:1. Mean Absolute Deviation MAZEThis is a self-checking worksheet that allows students to strengthen their understanding of finding the mean absolute deviation. Students use their answers to navigate through the puzzle.2. Mean Absolute Deviation RIDDLEStudents find the mean absolute deviation of various data sets. Students use their answer
Subjects:
Grades:
5th - 7th
Types:
Also included in: 6th Grade Math Assessments, Notes, Task Cards, Worksheets BUNDLE
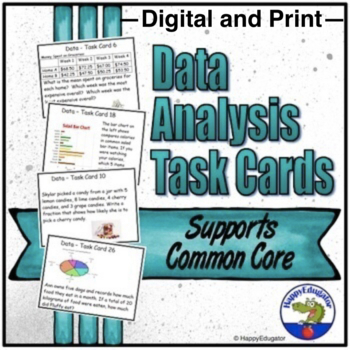
Data Analysis Task Cards Math Test Prep - Easel Activity Digital and Print
Data Analysis Task Cards. 30 task cards on data collection and data analysis, answer recording sheet, and answer key. Great for math test prep. Print or digital. Tasks includes finding range, median, mode and mean of a set of data, creating pictographs, interpreting line plots, stem and leaf plots, bar graphs, circle graphs, box and whisker plots, probability, random and biased samples.Digital and Print: Includes an Easel Activity ready for learning with digital tools. Assign it online in Googl
Subjects:
Grades:
5th - 8th
Types:
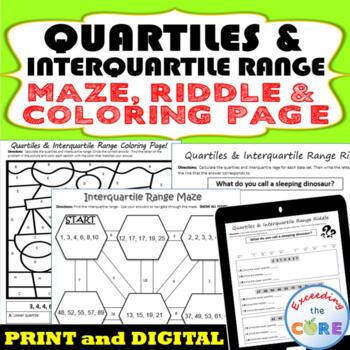
QUARTILES & INTERQUARTILE RANGE Maze, Riddle, Coloring Page | PRINT & DIGITAL
Have your students practice finding the QUARTILES, MEDIAN AND INTERQUARTILE RANGE of a data set with these fun activities including a maze, riddle, and coloring activity. What's Included:1. Quartiles and Interquartile Range COLORING ACTIVITY Students are prompted to find the first quartile, median, third quartile, and interquartile range (IQR) . Students use their solutions to color the picture. 2. Interquartile Range MAZEThis is a self-checking worksheet that allows students to strengthen thei
Subjects:
Grades:
6th - 8th
Types:
Also included in: 7th GRADE MATH Assessments, Warm-Ups, Task Cards, Worksheets BUNDLE
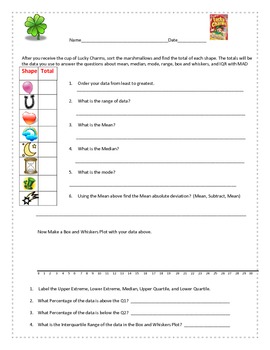
Lucky Charms -Statistics, Mean, Median, Mode, Box and Whiskers Plot
Lucky Charms -Statistics, Mean, Median, Mode, Box and Whiskers Plot.
This is a fun activity to do with your kids to review statistics. The students will enjoy sorting the marshmallows and counting the data to be used for statistics. The first part is individual data but the second part is combining the class data. Make sure your data range will fit on the box plot.
Subjects:
Grades:
4th - 8th
Types:
Also included in: Statistics Unit
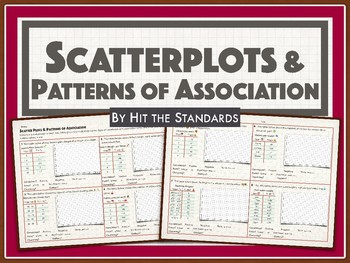
Scatterplots & Patterns of Association
Students must construct and interpret scatter plots from 8 different data tables and investigate patterns of association such as clustering, outliers, positive or negative correlation, linear or nonlinear association. Data tables are based on real world problems, students must plot the data points to construct the scatter plots. Common Core 8SP.1 & 8SP.2TEKS 8.11A Save $$$ and time by downloading the complete 8th Grade Math Unit10 Making Connections (End of Year Activities) (STAAR review) 4
Subjects:
Grades:
6th - 9th
Types:
CCSS:
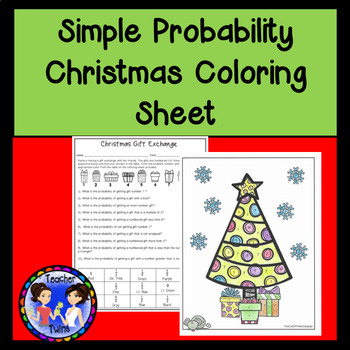
Probability of Simple Events Christmas Math Coloring Sheet
Do your students love to color? Try this Probability of Simple Events Christmas Math Coloring Sheet! This Probability Coloring Sheet contains 10 finding simple events problems. Using this Christmas coloring sheet is a great way to keep students working during the holiday season! This coloring sheet is perfect for reviewing how to find the probability of simple events. Easy setup and clear directions for students make this Probability of Simple Events Christmas Math Coloring Sheet perfect for da
Subjects:
Grades:
7th - 9th
Types:
Also included in: Middle School Math Christmas Bundle 2
Mean Median Mode Color by Number Aztec (Distance Learning)
I hope you enjoy my Aztec patterned color by number activities!Note: Using a digital color by number activity works best with iPads where coloring can be done using an app such as Notability.In this fifteen question activity students will find measures of central tendency (averages). Mean, median, and mode are included and some of the means will need to be rounded to the nearest tenth. Answer key includedCCSS: 6.SPCCSS: 7.SPCheck out these related notes:- Mean, Median, Mode & Range NotesHe
Subjects:
Grades:
5th - 8th
Types:
Also included in: Color by Number Bundle
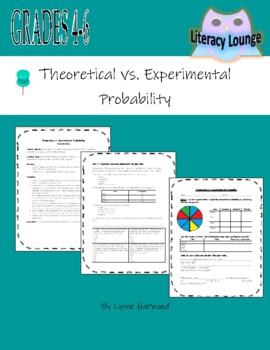
Theoretical vs. Experimental Probability Lesson Plan and Materials
This activity teaches the difference between theoretical probability and experimental probability: why things that happen in real life do not exactly match probability. Students first find the theoretical probability of landing on each color of a spinner, then use the spinner to conduct their own experiment. They learn that the results of the experiment are close the the theoretical probabilities, but not exact. Theoretical probability is an estimate; experimental probability is the actual r
Subjects:
Grades:
5th - 8th
Types:
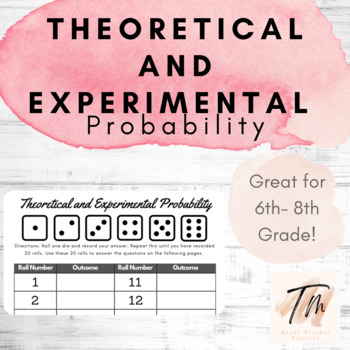
Theoretical and Experimental Probability Activity with Dice
This is a great hands on activity to have students compare theoretical and experimental probability! You could use a real die or find a dice roller online.
Subjects:
Grades:
6th - 8th
Types:
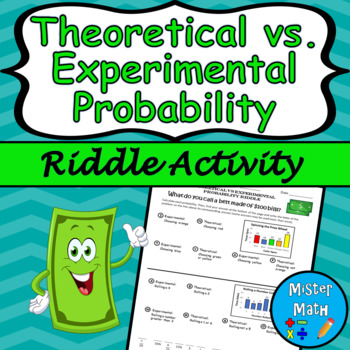
Theoretical vs. Experimental Probability Riddle Activity
Looking for a fun way for students to practice theoretical and experimental probability? This riddle activity is an engaging way for students to strengthen their skills in calculating probability while having fun! Guaranteed they will get a kick out of the terrible punchline at the end! This riddle activity contains 12 questions where students will be asked to find the theoretical and experimental probability of various events by analyzing data in bar graphs. An answer key is included.☆ Perfect
Subjects:
Grades:
6th - 9th
Types:
Also included in: Probability MEGA BUNDLE
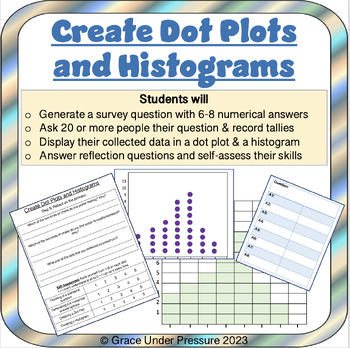
Create Dot or Line Plots and Histograms: Display Numerical Data 6th Grade Stats
Help your 6th grade and middle school math students learn about statistics, data collection, and data presentation in a hands-on and meaningful way! In this product students will:- Generate their own survey question with 6-8 numerical answers (samples included)- Ask 20 or more people their question & record answers in a tally chart- Display their collected data in a dot plot or line plot and then a histogram (the blank templates are included so all students can be successful)- Answer reflect
Subjects:
Grades:
5th - 8th
Types:
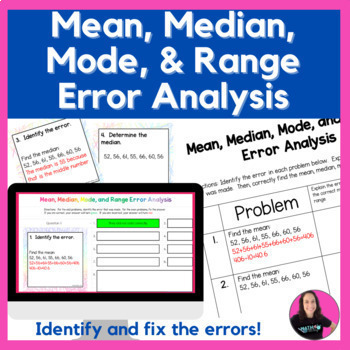
Mean, Median, Mode, & Range Digital & Printable Activity
In this 6th grade error analysis activity, students will identify mistakes in finding the mean, median, mode, and range of a set of data. Then, students will determine the correct answers.Students will use a digital drop down menu to see each task card and complete the problems. They will receive immediate feedback if they answered correctly or not when determining the measures of central tendency.The same problems are also provided on the printable version, so that students can write out the
Subjects:
Grades:
5th - 7th
Types:
CCSS:
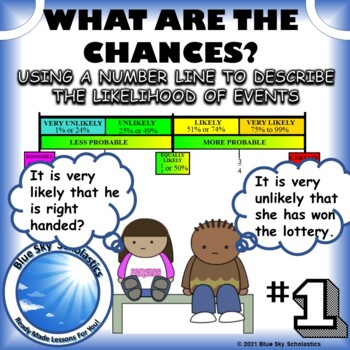
Using a probability number line to describe the likelihood of an event occurring
Your students can represent the probability as a fraction or percent and use probability terms to describe the likelihood of an outcome. These worksheets take it one step further by using a number line to match the fractions/percentages representations with the probability descriptions: impossible, unlikely, very unlikely, equally likely, likely, very likely, and certain. Your students will love the activity of describing the likelihood of sitting next to a stranger who may have won the lotter
Subjects:
Grades:
5th - 8th
Types:
CCSS:
Also included in: Probability Unit Bundle - NEW 2020 Ontario Math Curriculum Grade 6
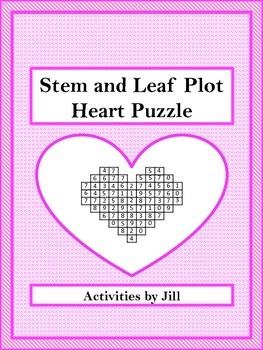
Stem and Leaf Plot Heart Puzzle FREEBIE (Distance Learning)
Students will practice finding range, mean, median, and mode using stem and leaf plots/graphs. They will then locate the answers in the heart-shaped # search puzzle.This is a great way to make practice more fun!Follow this link to see this same free product in Spanish: Una rompecabezas con un diagrama de tallo y hojas. Please leave feedback if you would like me to make more of my products available in Spanish! I am using this free lesson to see if there is interest for these in ESL or bilingu
Subjects:
Grades:
5th - 8th
Types:
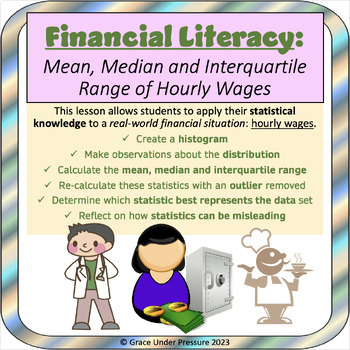
Grade 6 Statistics & Finance: Mean, Median, Interquartile Range & Positive Skew
Financial Literacy:Mean, Median and Interquartile Range of Hourly WagesThis lesson allows students to apply their statistical knowledge to a real-world financial situation: hourly wages. They also have the chance to think about the fairness of income inequality and how statistics can be misleading when reported in the media. They will:- Create a histogram to display 10 hourly wages- Make observations about the distribution- Calculate the mean, median and interquartile range of the data set- Re-c
Subjects:
Grades:
6th - 8th
Types:
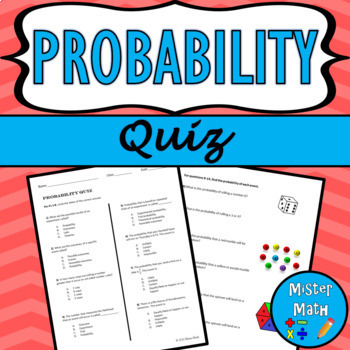
Probability Quiz
Assess your students' knowledge and skills in finding probability with this 22-question quiz! The quiz includes multiple choice and open-response questions, as well as real-life application questions. An answer key is also provided. Overall, the 4-page quiz covers the following topics:Outcomes & EventsDescribing LikelihoodSimple ProbabilityTheoretical/Experimental ProbabilityUsing Theoretical ProbabilityMaking PredictionsComparing Theoretical & Experimental Probability☆ CLICK HERE TO CHE
Subjects:
Grades:
6th - 9th
Also included in: Probability MEGA BUNDLE
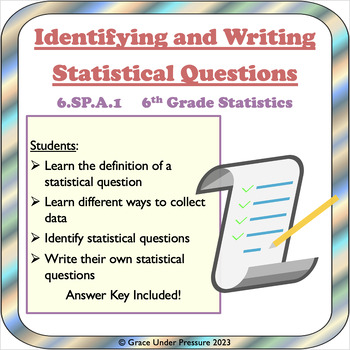
Identifying and Writing Statistical Questions and Ways to Collect Data 6.SP.A.1
This lesson is perfect for your 6th Grade Statistics Unit and it specifically addresses CCS Standard 6.SP.A.1Students:- Learn the definition of a statistical question: a question that has numerical answers that vary- Learn different ways to collect data (survey, measure, use previously collected data, observe)- Identify statistical questions (8 questions are listed and 5 of them are statistical)- Write their own statistical questions (students write 3 statistical questions and 1 that is not and
Subjects:
Grades:
5th - 8th
Types:
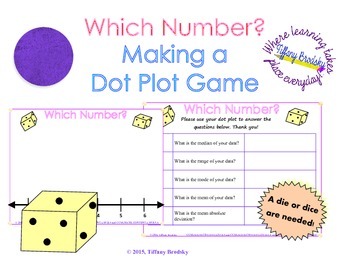
Dot Plot Graphing and Worksheet Activity (or Game)
A fantastic activity for practice after teaching mean, median, range, and mean absolute deviation. Students roll a die and plot their own graphs. Wonderful! What's Included:PDF for easy printing (color and black and white copy; you choose the best for printing)activity formatted for Easel (this is a pen activity)(You will need one die per person or group. This is not included.)This is an activity which you can simply print and set in a math center or give as an assignment. This game or activ
Subjects:
Grades:
5th - 7th, Adult Education
Types:
Sept. 25 Math & Supreme Court Puzzle: Sandra Day O’Connor | Daily Mixed Review
On September 25 of the Mystery Year, Sandra Day O'Conner was sworn in as the first woman justice of the Supreme Court. As students solve clues to find the year, they review percent, mean when given the total and the number of scores, proportions, and reasoning skills. This puzzle provides engaging review of middle school math topics. Your PDF download includes:2-page digital version with horizontal layout, prepped for Easel 1-page printable version3 pages of Teacher Notes including step-by-step
Subjects:
Grades:
6th - 8th
Types:
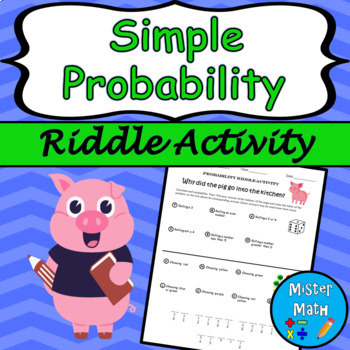
Probability Riddle Activity
Looking for a fun way for students to practice simple probability? This riddle activity is an engaging way for students to strengthen their skills in calculating probability while having fun! Guaranteed they will get a kick out of the terrible punchline at the end! This riddle activity contains 13 questions where students will be asked to find the probability of various events involving number cubes and marbles. An answer key is included.☆ Perfect for centers, partner work, independent practice,
Subjects:
Grades:
6th - 9th
Types:
Also included in: Probability MEGA BUNDLE
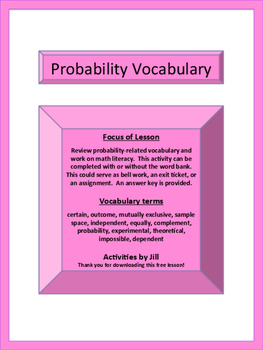
Probability Terms Worksheet with Word Bank (Distance Learning)
Focus of LessonReview probability-related vocabulary and work on math literacy. This activity can be completed with or without the word bank. This could serve as bell work, an exit ticket, a math center, or an assignment.Vocabulary termscertain, outcome, mutually exclusive, sample space, independent, equally, complement, probability, experimental, theoretical, impossible, dependentUse this note-taking product to introduce the vocabulary terms!Probability Vocabulary NotesCCSS 7.SPProbability Te
Subjects:
Grades:
6th - 9th
Types:
Showing 1-24 of 42 results


