32 results
Common Core HSS-MD.A.3 microsofts
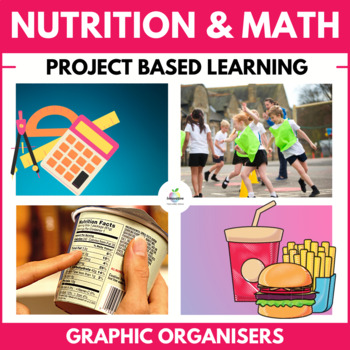
Food & Nutrition Labels | Healthy Eating Math Unit | Statistics & Data | PBL
Teach your students the importance of HEALTHY EATING with this engaging NUTRITION LABEL reading unit. Students will learn to evaluate nutrition labels and make informed choices about DIET and the foods they consume.This NO-PREP, MULTIDISCIPLINARY MATH UNIT will keep them engaged as they learn about FAST FOOD, what they are putting in their mouth, and the amount of activity required to burn it off. AN ESSENTIAL LIFE SKILL.Most students love ♨️FAST FOOD♨️; maybe it's a guilty pleasure, but do we
Subjects:
Grades:
4th - 9th
Also included in: Innovative Substitute Teaching Bundle | No Prep Sub Plans
High School Math Common Core Aligned IEP Goal Bank
This IEP goal bank was created to assist special education teachers with the task of writing standards-based IEP goals in math. After spending countless hours developing IEP goals myself and really having to think through how to best individualize goals and objectives for my own students, I wanted to share this resource to help other special education teachers gain back some of their time.This goal bank includes the following:An introduction and guide that explains how to use the document.Each s
Subjects:
Grades:
9th - 12th
CCSS:
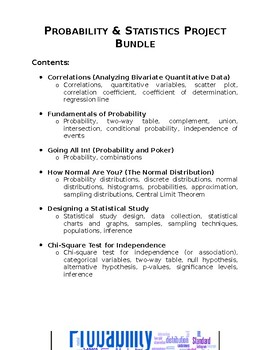
Probability & Statistics Project Bundle
A bundle that contains six different projects for a Probability & Statistics high school course. This bundle includes: Correlations (Analyzing Bivariate Quantitative Data) Fundamentals of Probability Going All In! (Probability, Combinations, and Poker) How Normal Are You? (The Normal Distribution) Designing a Statistical Study Chi-Square Test for Independence These projects are designed to engage students in authentic, hands-on, performance-based tasks. For each of these projects, students c
Subjects:
Grades:
9th - 12th
Types:
CCSS:
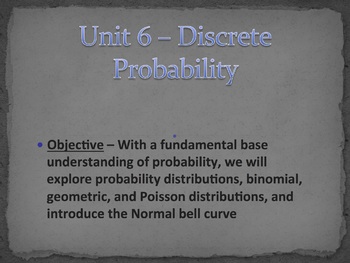
Statistics Unit 6 Bundle - Discrete Probability (12 days)
This is a unit plan bundle for a Statistics class. The plans include common core math standards, time frame, activities, enduring understandings, essential questions, and resources used. It is designed to last 12 days, depending on pacing. The plans include: 39-slide presentation, with annotated guide for reference3 Worksheets"Do Now" Entrance problems2 quizzesSpreadsheet Activity - Binomial, Geometric, Poisson DisributionsReview slides (for student-group communicators)Unit test (with review pac
Subjects:
Grades:
9th - 12th, Higher Education
CCSS:
High School Math IEP Goal Bank - Statistics and Probability
This IEP goal bank was created to assist special education teachers with the task of writing standards-based IEP goals in math. After spending countless hours developing IEP goals myself and really having to think through how to best individualize goals and objectives for my own students, I wanted to share this resource to help other special education teachers gain back some of their time.This goal bank includes the following:An introduction and guide that explains how to use the document.Each s
Subjects:
Grades:
9th - 12th
CCSS:
AP Statistics Kahoots (10 total): No Prep game/activity for AP Statistics Exam
Get ready to supercharge your AP Statistics exam prep with these 10 Kahoot links! With 10-15 questions in each Kahoot, your students will have daily practice to help them ace the exam at the end of the year. These Kahoots are specifically designed using AP test material, so you can be sure your students are getting the best preparation possible. Perfect for quick spiral review, warm-ups, or closing out class, these Kahoots are the ultimate tool for helping your students succeed. And with the opt
Subjects:
Grades:
10th - 12th
Types:
CCSS:
Statistics Unit 7 Bundle - Normal Distribution (12 days)
This is a unit plan bundle for a Statistics class. The plans include common core math standards, time frame, activities, enduring understandings, essential questions, and resources used. It is designed to last 12 days, depending on pacing. The plans include: 41-slide presentation, with annotated guide for reference4 Worksheets"Do Now" Entrance problems2 quizzesSpreadsheet Activity - Normal DistributionReview slides (for student-group communicators)Unit test (with review packet)Pacing Guide with
Subjects:
Grades:
9th - 12th
CCSS:
9th Grade Saxon Secondary 1 Math Powerpoints
These 120 Powerpoint lessons work hand in hand with the Saxon Algebra 1 math textbook. If you do not teach the Saxon program then these Powerpoints can be used to help teach the Secondary 1 Common Core. Each Powerpoint consists of a lesson overview which includes formulas and direct instructions. After that there are several practice problems that allows students to put into practice what they just learned. This is a great opportunity for group work as well as for the teacher to walk around the
Grades:
8th - 9th
Types:
CCSS:
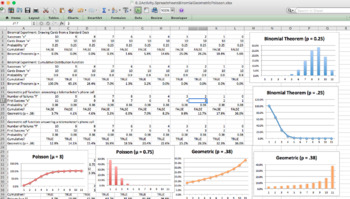
Statistics Spreadsheet Activity - Binomial, Geometric, Poisson (2 days)
Statistics Spreadsheet Activity - Binomial, Geometric, Poisson (2 days) This is a 1-2 day spreadsheet activity for a Statistics class. It uses spreadsheets as a walkthrough to allow students to explore the Binomial, Geometric, and Poisson distributions, as well as create graphs of the distributions. The product includes: 6.3 Spreadsheet Activity (Also included in " Statistics Unit 6 Bundle - Discrete Probability (12 days)" and in " A Mountain of Statistics Curriculum - One Full Year Bundle")Exce
Subjects:
Grades:
9th - 12th, Higher Education
Types:
CCSS:
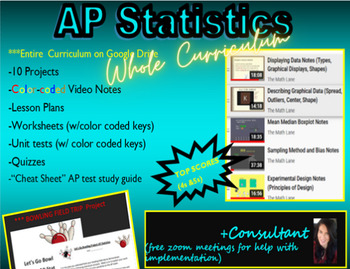
AP Statistics/Stats FULL Curriculum LINK (notes, wksts, PROJECTS) and Consultant
Get ready to supercharge your students' AP Statistics experience with this dynamic curriculum! With over 50% of students earning 4s or 5s on the AP exam, this program is proven to deliver top results. Featuring color-coded video notes, worksheets, activities, and 10 engaging projects, this curriculum is designed to keep students engaged and excited about statistics. Plus, with a Bowling Field Trip Project Opportunity included, students will have the chance to apply their knowledge in a real-worl
Subjects:
Grades:
10th - 12th
CCSS:
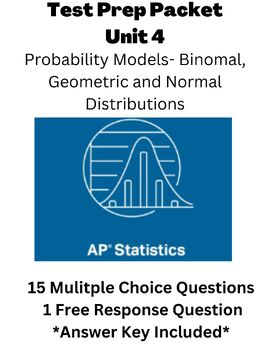
AP Statistics- Probability Models: Geometric, Binomial and Normal Distributions
**All questions in this document are NEW and solutions cannot be googled**(as of this post on 6/6/23)Test-prep practice directly aligned to College Board's CED for AP Statistics. This packet contains 15 multiple choice questions and 1 free response question, in addition to an answer key. The content covered spans across the use of probability models including geometric, binomial and normal distributions. The download is an editable word document.This document would be great to use as review for
Subjects:
Grades:
9th - 12th
Types:
CCSS:
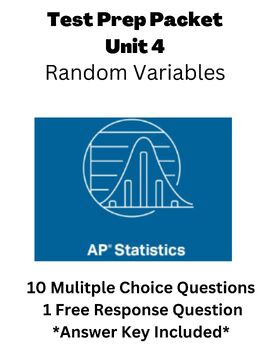
AP Statistics- Discrete and Continuous Random Variable Practice
**All questions in this document are NEW and solutions cannot be googled**(as of this post on 6/6/23)Test-prep practice directly aligned to College Board's CED for AP Statistics. This packet contains 10 multiple choice questions and 1 free response question, in addition to an answer key. The content covered in this packet includes practice on discrete and continuous random variables, with focus on finding expecting values, standard deviation, combining variables, transforming variables, and usin
Subjects:
Grades:
9th - 12th
Types:
CCSS:
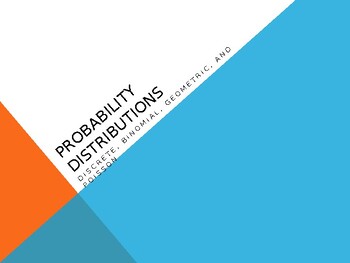
Probability Distributions PowerPoint: Discrete, Binomial, Geometric, Poisson
This 30-slide PowerPoint walks students through the basics of:discrete probability distributionsfinding the mean, variance, and standard deviation of a discrete probability distributionbinomial distributions using the formulabinomial distributions using the binomial distribution chartexpected valuefinding the mean, variance, and standard deviation of a binomial distributionthe geometric distribution, including an examplethe Poisson distribution, including an example
Subjects:
Grades:
9th - 12th, Higher Education
CCSS:
Also included in: Probability and Statistics PowerPoints
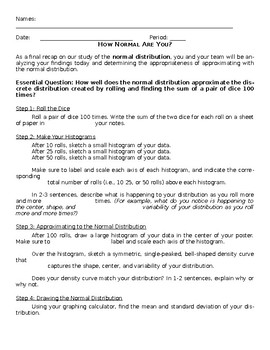
Project: How Normal Are You? (The Normal Distribution)
Project guidelines and rubric for a project on probability distributions, more specifically discrete and normal distributions. Students create histograms to display their data (the sum of two dice) at various stages (10, 25, 50, and 100 rolls), approximate the normal curve to their discrete distribution, draw a normal curve, calculate probabilities for both the discrete and normal distributions, and assess their approximation. This project also teases the concepts of sampling distributions and
Subjects:
Grades:
9th - 12th
Types:
CCSS:

Independent Variables, Dependent Variables, & Contingency Tables, Animated PPW
This Independent Variables, Dependent Variables, & Contingency Tables resource contains an interactive and animated PowerPoint for your scientific method or statistics unit. You can also purchase the matching scaffolded notes. There is a Tip & Tricks slide and corresponding note page that compiles feedback, notes, and helpful information I have personally seen benefit my students.Please be aware that this lesson was designed for a criminal justice-based statistics course; as such, topics
Subjects:
Grades:
Not Grade Specific
CCSS:
NGSS:
MS-PS3-4
, 5-PS1-3
, 5-PS1-4
, HS-PS3-4
, HS-PS2-5
...

All of the Common Core Math Standards Checklists
This is a bundle of checklists for Math Common Core Standards for all of the grades (K-12) on an excel spreadsheet with 5 columns for data input. These standards are organized in their own sub-domains to coordinate lessons. Please see my free file for an example.
Subjects:
Grades:
K - 12th
Types:
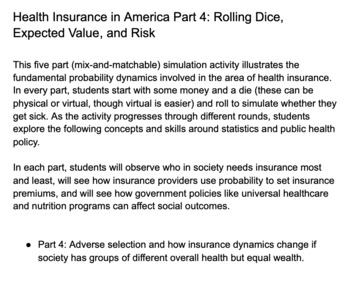
Health Insurance in America Part 4 (Activity and Teacher Guide)
Health Insurance in America Part 4: Rolling Dice, Expected Value, and RiskThis five part (mix-and-matchable) simulation activity illustrates the fundamental probability dynamics involved in the area of health insurance. In every part, students start with some money and a die (these can be physical or virtual, though virtual is easier) and roll to simulate whether they get sick. As the activity progresses through different rounds, students explore the following concepts and skills around statisti
Subjects:
Grades:
9th - 12th
Types:
CCSS:
Also included in: Simulating Health Insurance in America: Full Activity and Teacher Guide
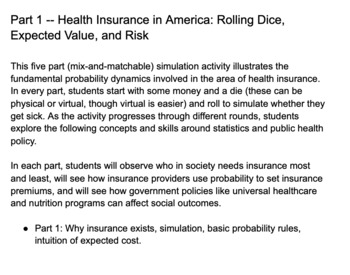
Health Insurance in America Part 1 (Activity and Teacher Guide)
Part 1 -- Health Insurance in America: Rolling Dice, Expected Value, and RiskThis five part (mix-and-matchable) simulation activity illustrates the fundamental probability dynamics involved in the area of health insurance. In every part, students start with some money and a die (these can be physical or virtual, though virtual is easier) and roll to simulate whether they get sick. As the activity progresses through different rounds, students explore the following concepts and skills around stati
Subjects:
Grades:
9th - 12th
Types:
CCSS:
Also included in: Simulating Health Insurance in America: Full Activity and Teacher Guide
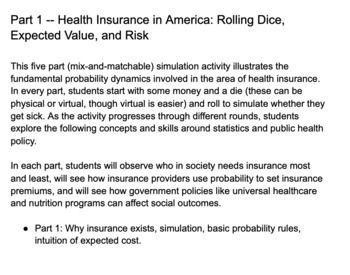
Health Insurance in America Part 1: Probability, Expected Value, and Risk
Health Insurance in America: Rolling Dice, Expected Value, and RiskThis five part (mix-and-matchable) simulation activity illustrates the fundamental probability dynamics involved in the area of health insurance. In every part, students start with some money and a die (these can be physical or virtual, though virtual is easier) and roll to simulate whether they get sick. In each part, students will observe who in society needs insurance most and least, will see how insurance providers use probab
Subjects:
Grades:
9th - 12th
Types:
CCSS:
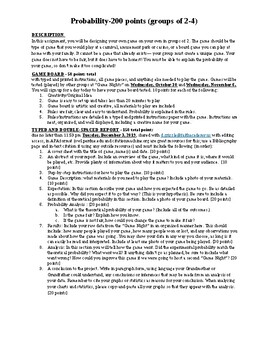
Bluman Statistics Chapter 4 Project
This is a Microsoft Word document, so it can be edited to fit your own classroom needs. It is a project I used in my 12th grade Statistics class. I gave it out the second week of second quarter and set aside one day a week to work with my students on this project through all of first quarter. I also hosted "Game Nights" in which we played and collected data from the games that were created for this project.This project is aligned with chapter 4 of Elementary Statistics: A Step by Step Approach 8
Subjects:
Grades:
11th - 12th, Higher Education
Types:
CCSS:

Math Common Core Standards for 9th-12th Grade
This is a checklist for all of the Math Common Core Standards for ninth through twelfth grade on an excel spreadsheet with 5 columns for data input. These standards are organized in their own sub-domains to coordinate lessons. Please see my free file for an example.
Subjects:
Grades:
9th - 12th
Types:
CCSS:
Also included in: All of the Common Core Math Standards Checklists
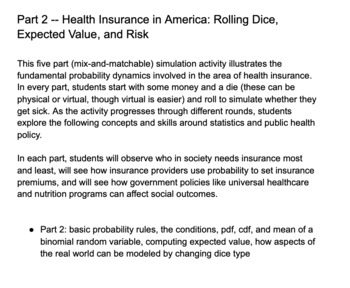
Health Insurance in America Part 2 (Activity and Teacher Guide)
Part 2 -- Health Insurance in America: Rolling Dice, Expected Value, and RiskThis five part (mix-and-matchable) simulation activity illustrates the fundamental probability dynamics involved in the area of health insurance. In every part, students start with some money and a die (these can be physical or virtual, though virtual is easier) and roll to simulate whether they get sick. As the activity progresses through different rounds, students explore the following concepts and skills around stati
Subjects:
Grades:
9th - 12th
Types:
CCSS:
Also included in: Simulating Health Insurance in America: Full Activity and Teacher Guide
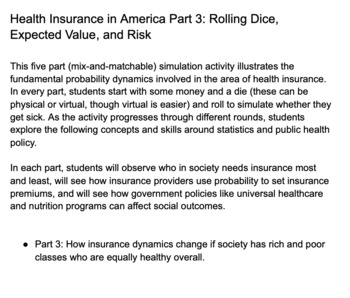
Health Insurance in America Part 3 (Activity and Teacher Guide)
Health Insurance in America Part 3: Rolling Dice, Expected Value, and RiskThis five part (mix-and-matchable) simulation activity illustrates the fundamental probability dynamics involved in the area of health insurance. In every part, students start with some money and a die (these can be physical or virtual, though virtual is easier) and roll to simulate whether they get sick. As the activity progresses through different rounds, students explore the following concepts and skills around statisti
Subjects:
Grades:
9th - 12th
Types:
CCSS:
Also included in: Simulating Health Insurance in America: Full Activity and Teacher Guide
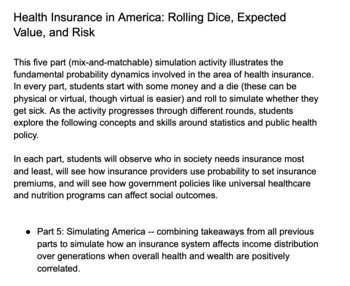
Health Insurance in America Part 5 (Activity and Teacher Guide)
Health Insurance in America: Rolling Dice, Expected Value, and RiskThis five part (mix-and-matchable) simulation activity illustrates the fundamental probability dynamics involved in the area of health insurance. In every part, students start with some money and a die (these can be physical or virtual, though virtual is easier) and roll to simulate whether they get sick. As the activity progresses through different rounds, students explore the following concepts and skills around statistics and
Subjects:
Grades:
9th - 12th
Types:
CCSS:
Also included in: Simulating Health Insurance in America: Full Activity and Teacher Guide
Showing 1-24 of 32 results

