57 results
High school graphing workbooks under $5
Making Science Charts and Graphs
A simplified look at making charts and organizing data in science.
-Data Charts
-Circle Graphs
-Bar Graphs
-Line Graphs
-Key Vocabulary List
-Quiz/Assessment
-Activity - Practice
-Teacher answer key for quiz and activity
Thanks for taking the time to stop by my store!
Mrs. Degs
Teaching Science Well
Blog: http://teachingsciencewell.wordpress.com/
Facebook: https://www.facebook.com/TeachingScienceWell
TPT: http://www.teacherspayteachers.com/Store/Teaching-Science-Well-Science-Resources
Pi
Subjects:
Grades:
3rd - 10th
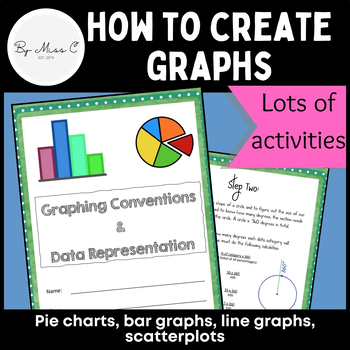
Guide to graphs: Pie charts, bar graphs, line graphs, scatterplots + activities
This is a fantastic resource for introducing students to graphing and data representation. This booklet will take students through the uses for particular graphs and how to construct them. At the end of each module, there are activities for students to complete, to practice their graphing skills. Answer key is included, making this a no-prep activity. This booklet covers: - why we visually represent data- pie charts and how to create them - bar graphs and how to create them - line graphs and how
Subjects:
Grades:
6th - 12th, Higher Education, Adult Education
Types:
CCSS:
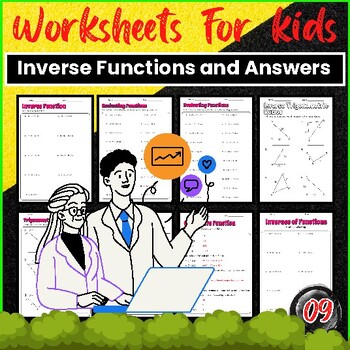
Inverse Functions Worksheet and Answers
In need of practicing your skills with inverse functions? Look no further than our comprehensive Inverse Functions Worksheet and Answers. This worksheet is designed for individuals who have a basic understanding of inverse functions and are looking to enhance their knowledge and mastery of this topic. With a range of thought-provoking questions and detailed solutions, this worksheet is the perfect resource to help you grasp the concept of inverse functions with ease and confidence.Table : Inv
Subjects:
Grades:
8th - 10th
Types:
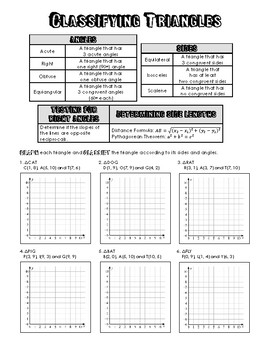
Classifying Triangles in a Coordinate Plane
Classifying Triangles in a Coordinate Plane
Grades:
7th - 12th
Types:

Coordinate Graphing - GraphX - Mascot Bundle #2
Dr. Sigma's World Of Mathematics Mascots #2 is a compilation workbook of mathematics worksheets that can be used by all levels of mathematics (upper elementary through high school). These worksheets involve solving problems and then plotting the answers as points which, once they are connected, form pictures. Included in this workbook are coordinate graphing exercises that make pictures of a devil, a pirate, a mustang and a bandit.Would you like to receive updates and information about new produ
Grades:
4th - 12th
Types:
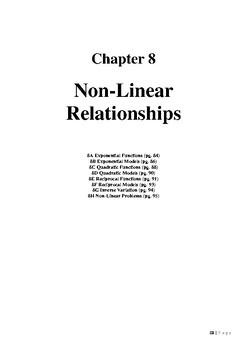
Mathematics Standard Non-Linear Relationships Workbook
A booklet on the Mathematics Standard topic of Non-Linear Relationships. Content includes,Exponential FunctionsExponential Models Quadratic FunctionsQuadratic ModelsReciprocal FunctionsReciprocal Models Inverse VariationNon-Linear Problems Worksheet includes YouTube links to support students in solving problems.For more great resources, visit my store
Subjects:
Grades:
10th - 12th
Types:
Also included in: HSC Mathematics Standard 2 Course Booklets
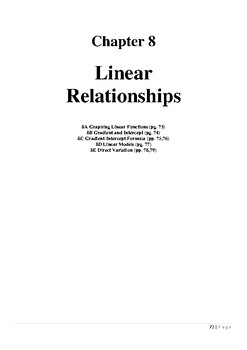
Mathematics Standard Linear Relationships Booklet
A booklet on the Mathematics Standard topic of Linear Relationships. Content includes, Graphing Linear FunctionsGradient and InterceptGradient-Intercept Formula Linear ModelsDirect VariationWorksheet includes YouTube links to support students in solving problems.For more great resources, visit my store
Grades:
9th - 12th
Types:
Also included in: Mathematics Standard Preliminary Course Booklets
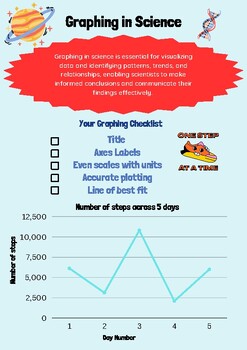
Line Graphing Booklet
This engaging booklet steps through all that is required for constructing a graph. Student's will look at uses of graphs, analysis as well as common mistakes committed when drawing one. An easy to follow checklist is included with each graph to ensure students do not forget each important part and develop sound graphing habits.
Subjects:
Grades:
4th - 10th
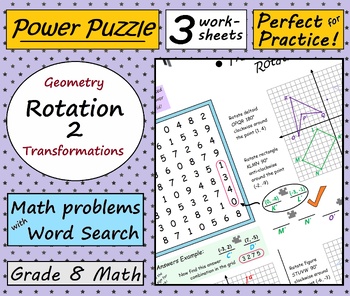
Grade 8 Math: Rotation 2 (Geometry) - bundled set of 3
Doing Geometry Rotations is fun with Power Puzzle worksheets. Set of 3. Find the Word Search answers inside! Rotation 2 requires students to rotate figures and shapes around points other than the origin. These problems use all 4 quadrants.After solving these problems, students can look for their answers in a Number Search grid. Students love Word Search and Number Search puzzles, and this follow-up activity tells students whether or not their answers are correct. If you can find your answer then
Grades:
7th - 9th

Coordinate Graphing - GraphX - Native Animals Bundle
Dr. Sigma's World Of Mathematics Native Animals is a compilation workbook of mathematics worksheets that can be used by all levels of mathematics (upper elementary through high school). These worksheets involve solving problems and then plotting the answers as points which, once they are connected, form pictures. Included in this workbook are coordinate graphing exercises that make pictures of a bear, a cardinal, a wolf and a hornet.Would you like to receive updates and information about new pro
Grades:
4th - 12th
Types:

Slope Home-Run
Play ball! Here is a great slope worksheet. Included is a baseball field worksheet with ordered pairs and one without, a page to record slope, and an answer key.
This worksheet will be a home run with your students. This worksheet provides a fun way to practice finding the slope. Students will draw lines from home plate to the baseballs in the outfield. Students will the find the slope of that line. They will find the slope and determine whether that line has a positive or negative slope.
Tak
Grades:
7th - 9th
Types:
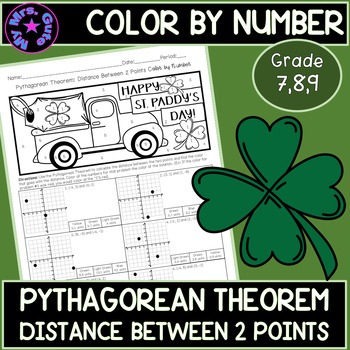
St. Patrick’s Pythagorean Theorem Distance Between 2 Points Color By Number
Calculate the distance between two points using the Pythagorean Theorem on this St. Paddy’s themed math worksheet. It is perfect for extra review, homework, a sub day, or something to help mathematically celebrate St. Patrick’s Day!There are 6 sets of points to find the distance between – one version has the points already plotted; the other has the coordinate planes blank. Students will create right triangles between the points and use the Pythagorean Theorem to calculate the distance, then, th
Subjects:
Grades:
7th - 9th
Types:
CCSS:
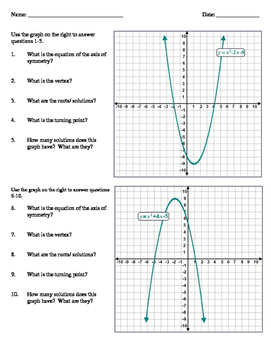
Quadratic Functions - 5 Worksheet Bundle
This packet has 5 lessons of quadratic practice. It also contains answer keys for each worksheet. The topics covered are:
Worksheet 1 & 2 - Identifying the key parts of a quadratic graph, specifically turning point/ vertex, axis of symmetry, and roots/ solutions.
Worksheet 3 - Solving quadratic equations algebraically and graphically. It stresses that the solutions of a quadratic can be found either way, and points out that regardless of which method you use, the answers will be the same
Grades:
9th - 10th
Types:

Quadratic Functions - Packet of Notes
This packet has 5 lessons of quadratic practice. It also contains answer keys for each worksheet. The topics covered are:
Worksheet 1 & 2 - Identifying the key parts of a quadratic graph, specifically turning point/ vertex, axis of symmetry, and roots/ solutions.
Worksheet 3 - Solving quadratic equations algebraically and graphically. It stresses that the solutions of a quadratic can be found either way, and points out that regardless of which method you use, the answers will be the same
Grades:
9th - 10th
Types:
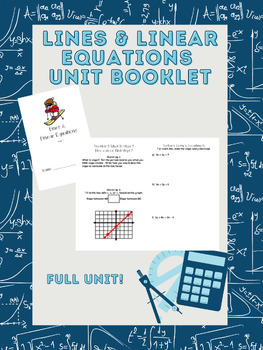
Lines & Linear Equations Unit Booklet (1 of 2)
This interactive, student-friendly booklet contains resources for an entire unit on Lines and Linear Equations. Booklet contains word problems, guided practice, and independent working problems. This booklet includes but is not limited to: Introduction to SlopeDetermining Steeper SlopesGraphing a Line that Passes through 2 PointsFinding Slope Given a GraphFinding Slope From a Table of ValuesFinding Slope in Real Life SituationsComparing Positive and Negative SlopesComparing Zero and Undefined Sl
Subjects:
Grades:
7th - 9th
Types:
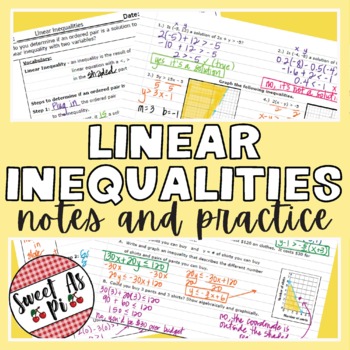
Writing and Graphing Linear Inequalities - Guided Notes and Practice
This step by step, discussion driven, no-prep notes and practice set that covers Linear Inequalities is a great way to teach & introduce graphing inequalities and reasonability of solutions to your students. The first page of the notes is more instructional and goes over how to confirm if a point is in the solution set and how to graph an inequality on the the coordinate plane with 2 examples to discuss together. The second page can be used as independent practice or as guided practice, whe
Grades:
7th - 10th
CCSS:
Also included in: Linear Equations and Inequalities - Notes & Practice UNIT BUNDLE
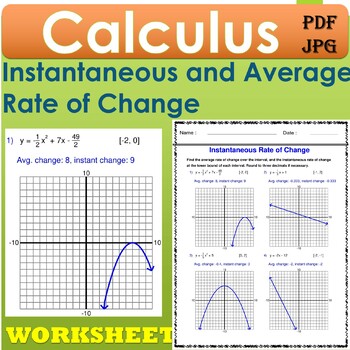
Instantaneous and Average Rate of Change - Calculus -
Thank you for choosing our store on TPT for your educational needs. We hope that our products and services have met your expectations and helped you achieve your learning goals.In these Calculus Worksheets you find problems that deal with finding the instantaneous and average rate of change over an interval for a function.The student will be given functions and will be asked to find the instantaneous rate of change at a point, and the average rate of change to compare to.Types of Equations: Pol
Grades:
11th - 12th, Higher Education
Types:
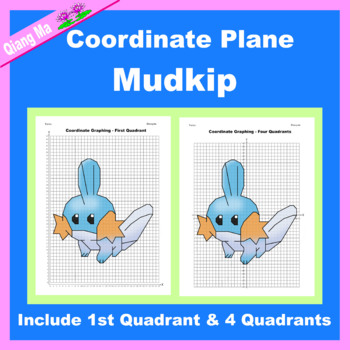
Pokemon Coordinate Plane Graphing Picture: Mudkip
This cartoon coordinate system graphic art mystery picture would be ideal for students that are just beginning with graphing coordinates or students that need a little extra practice. It is also a great fun activity and engaging worksheets for Grade 4-12 for any time of the year. Prep free! Differentiated! Independent!The picture has two different graphing options to easily provide differentiation in your classroom. - One picture to be graphed in first quadrant with positive whole numbers
Subjects:
Grades:
4th - 12th
Types:
Also included in: Pokemon Coordinate Plane Graphing Picture: Pokemon Bundle 7 in 1
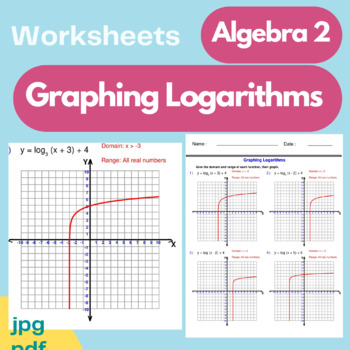
Graphing Logarithms Worksheets - Give the domain - Algebra 2
Algebra 2 Exponential and Logarithmic FunctionsGraphing Logarithms WorksheetsThis Algebra 2 Graphing Logarithms worksheet will give you logarithmic functions to graph.Graphing logarithms is the process of creating a visual representation of a logarithmic function. A logarithmic function is a type of mathematical function that expresses a relationship between a variable and its logarithm. The graph of a logarithmic function is a curve that can take on different shapes depending on the specific f
Subjects:
Grades:
10th - 12th
Types:
Also included in: Logarithmic Functions Worksheets - BUNDLE

Modelling Predator-Prey Relationships
About this ProductThis lesson is the third in the series of modelling populations using EXCEL. The first was Modelling Population Growth where students modeled an unconstrained population to explore exponential growth when there is an abundance of resources and no limitations for growth. The second was Modelling Competition where students explored a population when competition for resources is taken into consideration. This third lesson takes the students through modelling the relationship betwe
Subjects:
Grades:
6th - 10th
Types:
Compare Proportional Relationships - 8.EE.5
Graph proportional relationships and interpret the unit rate as the slope of the graph. Compare two different proportional relationships represented in different ways. Scaffolded lesson provides for classroom differentiation. Can be used as a lesson leader, guided practice, independent practice, for cooperative learning and math centers, or as an assessment. Use with smartboard, projector, computer, pad or as printable. Lesson is complete - NO PREP. Editable version included.
Objectives:
- Comp
Grades:
7th - 9th
CCSS:

Coordinate Graphing - GraphX - Mascots #1
Dr. Sigma's World Of Mathematics Mascots #1 is a compilation workbook of mathematics worksheets that can be used by all levels of mathematics (upper elementary through high school). These worksheets involve solving problems and then plotting the answers as points which, once they are connected, form pictures. Included in this workbook are coordinate graphing exercises that make pictures of a bull, a gator, a wolverine and a patriot.
Would you like to receive updates and information about new pr
Grades:
4th - 12th
Types:
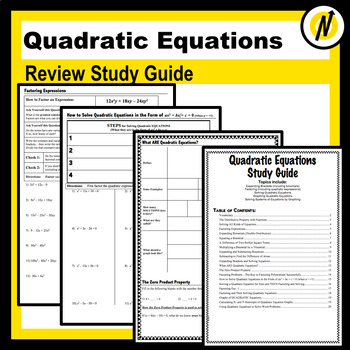
Solving Quadratic Equations Review Study Guide Graphic Organizers
This is a 20 page study guide I use when introducing students to quadratic equations. It includes pages with worked out examples, graphic organizers for writing the steps, and lots of practice problems, grouped by how they are solved. This study guide focuses on putting equations into standard form in order to solve by factoring. Also great for summer review and remediation!Topics include:VocabularyThe Distributive Property with FractionsSolving All Kinds of EquationsFactoring ExpressionsExpandi
Grades:
7th - 10th
CCSS:

Modelling Competition - Exploring Population Growth
About this productIn this lesson, which students can use as an independent activity, or one you could deliver via remote learning, the students will be provided with a scenario where a population of an organism is competing for resources in a particular habitat. In this case the scenario is Rainbow Trout Farming in a lake. The student workbook is designed in a way that the students will be guided through developing a model using EXCEL to explore the population growth of the trout taking into con
Subjects:
Grades:
6th - 9th
Types:
Showing 1-24 of 57 results


