129 results
High school End of Year statistics interactive whiteboards
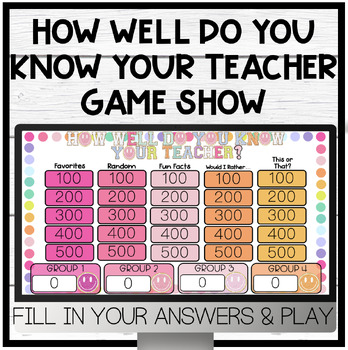
How Well Do You Know Your Teacher Game Show | End of Year Interactive Activity
Looking for a FUN and ENGAGING way to see how well your students know you? Look no farther! This "How Well Do You Know Your Teacher" Game Show is perfect for you! My students BEG to play these jeopardy style games and get so excited to compete against their classmates! Your students will love it too and have so much fun while testing their knowledge on you at the end of the year! *Fill in your answers to the premade questions and play OR edit the questions and fill in your answers to play!Catego
Subjects:
Grades:
K - 12th
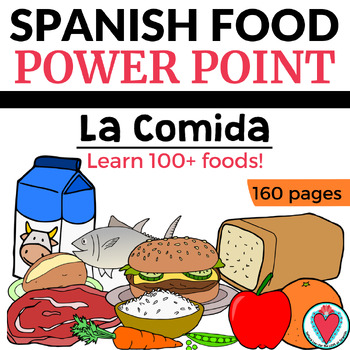
Spanish Food Unit 100 Foods in Spanish Vocabulary Words Pictures La Comida PPT
Learn 100+ Spanish food vocabulary words using images with this PowerPoint presentation! Practice the names of foods and drinks in Spanish with 162 pages of comprehensible input. Includes vivid pictures of food with and without the word in Spanish. Must have teaching resource for your food unit.Visual learners learn by reading or seeing pictures and remember things by sight. You will love the vivid images and bold text to introduce Spanish 1 food words. Big and bold font, easy to read from acros
Subjects:
Grades:
6th - 11th

The most annoying things - ESL adult and kid conversation classes
This presentation contains a GREAT 47 slide PowerPoint lesson in editable PPT format with 2 work papers and a teacher’s note, for a 90 min. lesson. The goal of this lesson is to introduce and practice useful idiomatic phrases to express annoying situations.ESL students use a very ‘stiff’ and ‘grammatically academically structured’ language – with this lesson, I aim to pull them out of their comfort zone. Some of the sentences they are required to use, are deliberately ‘borderline’ slang, because
Subjects:
Grades:
5th - 12th, Higher Education, Adult Education
Introduction to Probability and Statistics Lesson Plan Bundle
Elementary Statistics - Introduction to Probability and Statistics Lesson Plan BundleThis bundle includes:-Introduction to Statistics and Types of Data-Data Collection, Sampling Techniques, and Studies-Introduction to Technology in Statistics Activity-Organizing Data Using Frequency Distributions-Histograms and Dot Plots-Graphs and Charts in Statistics-Organizing and Presenting Data Using Technology Activity-Measures of Central Tendency-Measures of Position-Measures of Variation-Introduction to
Subjects:
Grades:
10th - 12th, Higher Education

Classroom Olympics/Minute To Win It!
This resource includes 2 versions: the SMART NOTEBOOK version AND THE PPT Version. You can download the PPT version into Google Slides, and convert it to work through google slides as well.This resource does a brief overview of the Olympics and then has slides of Minute To Win It Classroom Activities!The first 10 pages are designed for class lecture about the Olympics. The following 11 pages are for the class to experience Olympic games. The games are all variations from the popular show Minute
Subjects:
Grades:
K - 12th, Higher Education, Adult Education, Staff
Confidence Intervals and Hypothesis Testing Lesson Plan Bundle
Elementary Statistics - Confidence Intervals and Hypothesis Testing Lesson Plan BundleThis bundle includes:-Confidence Intervals for the Mean-Confidence Intervals for Proportions-Confidence Intervals for Variance and Standard Deviation-Introduction to Hypothesis Testing-Hypothesis Testing for the Mean-Hypothesis Testing for Proportions-Hypothesis Testing forVariance and Standard Deviations-Other Uses of Hypothesis Testing-Confidence Intervals and Hypothesis Testing Test-Confidence Intervals and
Subjects:
Grades:
10th - 12th, Higher Education
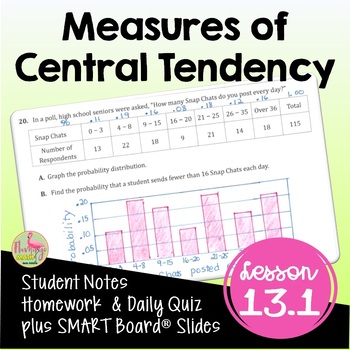
Measures of Central Tendency (Algebra 2 - Unit 13)
Measures of Central Tendency Algebra 2 Lesson:Your Pre-AP Algebra 2 Honors students will draw, analyze and interpret box-and-whisker plots, find outliers, and calculate measures of central tendency in this unit 13 lesson on Data Analysis & Statistics that cover the concepts in depth. #distancelearningtptWhat is included in this resource?⭐ Guided Student Notes⭐ Google Slides®⭐ Fully-editable SMART Board® Slides⭐ Homework/Practice assignment⭐ Lesson Warm-Up (or exit ticket)⭐Daily Content Quiz
Subjects:
Grades:
8th - 11th, Higher Education
CCSS:
Also included in: Algebra 2 Curriculum Mega Bundle | Flamingo Math
Probability and Counting Rules Lesson Plan Bundle
Elementary Statistics - Probability and Counting Rules Lesson Plan BundleThis bundle includes:-Introduction to Probability-Addition Rules for Probability-Multiplication Rules and Conditional Probability-Notation and Symbols in Probability-Permutations and Combinations-Application of Counting Rules-Probability and Counting Rules Test-Probability and Counting Rules Quiz (Bonus File)-Sample Space Handout (Bonus File)-Pacing Guide (Bonus File)Preview: Please refer to the above links for additional p
Subjects:
Grades:
10th - 12th, Higher Education
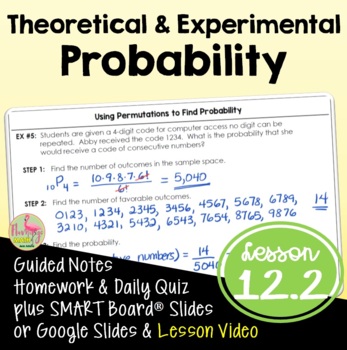
Theoretical and Experimental Probability (Algebra 2 - Unit 12)
Theoretical & Experimental Probability Algebra 2 Lesson:Your Pre-AP Algebra 2 Honors students will find both experimental and theoretical probabilities in this Unit 12 lesson. #distancelearningtptWhat is included in this resource?⭐ Guided Student Notes⭐ Google Slides®⭐ Fully-editable SMART Board® Slides⭐ Homework/Practice assignment⭐ Lesson Warm-Up (or exit ticket)⭐ Daily Content Quiz (homework check)⭐ Video Lesson Link for Distance Learning - Flipped Classroom models⭐ Full solution setStude
Subjects:
Grades:
8th - 11th, Higher Education
CCSS:
Also included in: Algebra 2 Curriculum Mega Bundle | Flamingo Math
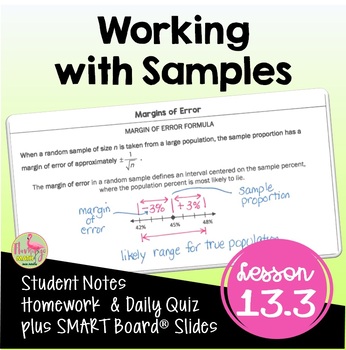
Working with Samples (Algebra 2 - Unit 13)
Working with Samples Algebra 2 Lesson:Your Pre-AP Algebra 2 Honors students will find draw, analyze and interpret box-and-whisker plots, find outliers, and calculate measures of central tendency in this unit 13 lesson on Data Analysis & Statistics that cover the concepts in depth. #distancelearningtptWhat is included in this resource?⭐ Guided Student Notes⭐ Google Slides®⭐ Fully-editable SMART Board® Slides⭐ Homework/Practice assignment⭐ Lesson Warm-Up (or exit ticket)⭐Daily Content Quiz (ho
Subjects:
Grades:
8th - 11th, Higher Education
CCSS:
Also included in: Algebra 2 Curriculum Mega Bundle | Flamingo Math
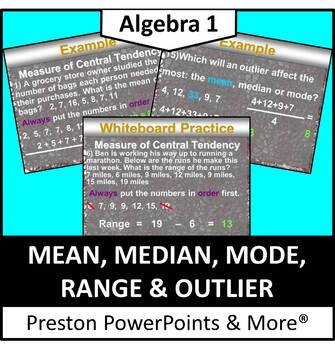
Mean, Median, Mode, Range and Outlier in a PowerPoint Presentation
Mean, Median, Mode, Range and Outlier in a PowerPoint PresentationThis slideshow lesson is very animated with a flow-through technique. It was made for my Algebra 1 class, but can be used for lower grades aw well. The lesson teaches how to solve for mean, median, mode and range. It also teaches to identify outliers in a set of data and find the measure of central tendency.NEW: The lesson is in an editable format so you can tailor the lesson to your class. The problems and clipart can’t be edit
Subjects:
Grades:
6th - 10th
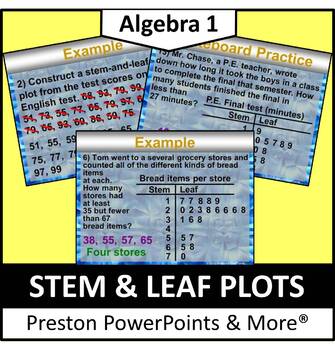
Stem and Leaf Plots in a PowerPoint Presentation
Stem and Leaf Plots in a PowerPoint PresentationThis slideshow lesson is very animated with a flow-through technique. I developed it for my Algebra 1 class, but it can be used for lower grades as well. This lesson was one of a chapter that was used as a review for all previous grades. The lesson teaches how to interpret data from the stem-and-leaf plot and make and use a stem-and-leaf plot to put data in order.NEW: The lesson is in an editable format so you can tailor the lesson to your class.
Subjects:
Grades:
6th - 9th
CCSS:
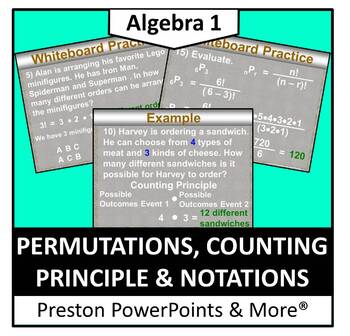
Permutations, Counting Principle and Notations in a PowerPoint
Permutations, Counting Principle and Notations in a PowerPoint PresentationThis slideshow lesson is very animated with a flow-through technique. I developed the lesson for my Algebra 1 class, but it can also be used for upper level class reviews. This lesson teaches how to find the total number of permutations, solve a combination problem, solve permutations and combination problem in notation form.NEW: The lesson is in an editable format so you can tailor the lesson to your class. The problem
Subjects:
Grades:
8th - 11th
CCSS:
Distributions of Data Lesson Plan Bundle
Elementary Statistics - Distributions of Data Lesson Plan BundleThis bundle includes:-Introduction to Probability Distributions-Mean and Standard Deviation of Probability Distributions-Binomial Distributions-The Normal Distribution-Find Z-Scores for Normal Distributions-Applications of Normal Distribution-Central Limit Theorem-Distributions of Data Test-Normal Distribution Table-Distributions of Data Quiz (Bonus File)-Pacing Guide (Bonus File)Preview: Please refer to the above links for addition
Subjects:
Grades:
10th - 12th, Higher Education

Watercolor Good Morning Slides
**See the Preview Video for a glimpse at each slide, design, and color!!** Perfect for Morning Work or Morning Meetings, this product includes 89 different "Good Morning" slides to display as kiddos enter the classroom. There are 3 designs included to give you the option of using the slides with or without the days of the week!_________________________________________________Check out the links below for more watercolor themed classroom décor!Watercolor "Good Morning" Slides2018 - 2019 Watercolo
Subjects:
Grades:
PreK - 12th
Types:

Statistics animated powerpoint lesson template
Content:1.Introduction2.Discrete Data3.Continuous Data4.Central Tendancy of a Data Set5.Range and Interquartile Range6.Box and Whisker Plot
Subjects:
Grades:
8th - 9th
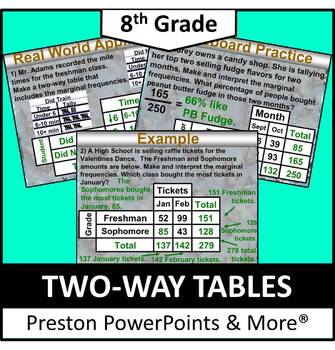
(8th) Two-Way Tables in a PowerPoint Presentation
8th Grade Math (Pre-Algebra) Two-Way Tables in a PowerPoint PresentationThis slideshow lesson is very animated with a flow-through technique. I developed the lesson for my 8th grade class, but it can also be used for upper level class reviews. This lesson teaches how to read two-way tables, make and interpret two-way tables, and use graphs to organize and solve real-life data problems, such as the most liked movie genre.This lesson has SKELETON NOTES, notes that have the problem only. I used t
Subjects:
Grades:
7th - 9th
CCSS:
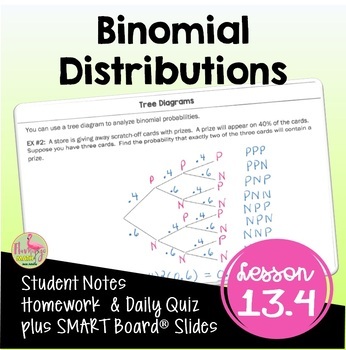
Binomial Distributions (Algebra 2 - Unit 13)
Binomial Distributions Algebra 2 Lesson:Your Pre-AP Algebra 2 Honors students will calculate measures of central tendency, draw, analyze, and interpret box-and-whisker plots and find outliers using binomial distributions in this Unit 13 lesson. #distancelearningtptWhat is included in this resource?⭐ Guided Student Notes⭐ Google Slides®⭐ Fully-editable SMART Board® Slides⭐ Homework/Practice assignment⭐ Lesson Warm-Up (or exit ticket)⭐ Daily Content Quiz (homework check)⭐ Video Lesson Link for Dis
Subjects:
Grades:
8th - 11th, Higher Education
CCSS:
Also included in: Algebra 2 Curriculum Mega Bundle | Flamingo Math

Statistics animated powerpoint template lesson part 1
Statistics animated lesson:content:1.Introduction2.Discrete Data3.Continuous Data4.Central Tendancy of a Data Set
Subjects:
Grades:
8th - 9th
Also included in: Statistics animated powerpoint lesson template
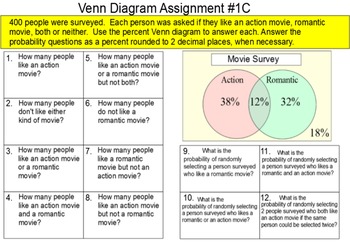
Venn Diagrams with Probability, 2 Lessons + 16 Assignments for SMART
Included in this zip folder are 19 SMART Notebook files. 2 are for instruction, 1 is a student reference handout and 13 are assignments. A brief description of each:
Instruction file #1 is a 36 slide introduction to reading a Venn diagram. Some formative assessment problems are included.
Instruction file #2 is a 25 slide introduction to the complement of a set in a Venn diagram.
Assignment A is a matching assignment. The student matches 10 2 circle Venn diagrams with union, intersection and
Subjects:
Grades:
8th - 11th
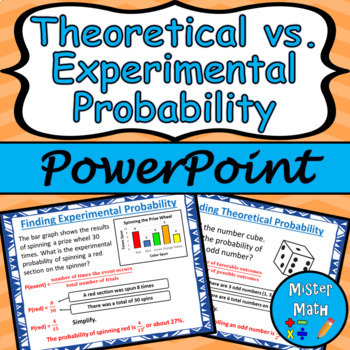
Theoretical vs. Experimental Probability PowerPoint Lesson
This is a PowerPoint Presentation to assist students in learning about theoretical and experimental probability. Students will learn the concepts of theoretical and experimental probability, as well as how to find the probabilities of each. Overall, the 21-slide PowerPoint Lesson covers the following topics:Theoretical ProbabilityUsing Theoretical ProbabilityExperimental ProbabilityMaking PredictionsComparing Theoretical & Experimental Probability Plenty of real-life examples are included to
Subjects:
Grades:
6th - 9th
Also included in: Theoretical vs. Experimental Probability PPT & Guided Notes BUNDLE
Correlation and Regression Lesson Plan Bundle
Elementary Statistics - Correlation and Regression Lesson Plan BundleThis bundle includes:-Scatter Plots and Correlation-Linear Regression-Complete Regression Analysis-Correlation and Causation-Correlation and Regression Test-Correlation and Regression Quiz (Bonus File)-Pacing Guide (Bonus File)Preview: Please refer to the above links for additional previews.Related ContentClick here to view more Elementary Statistics materialsClick here to view more Lesson Plan Bundles----Customer Tips----Get c
Subjects:
Grades:
10th - 12th, Higher Education

Statistics animated powerpoint lesson template part 2
Statistics part 2:1.Range and Interquartile Range2.Box and Whisker Plot
Subjects:
Grades:
8th - 9th
Also included in: Statistics animated powerpoint lesson template
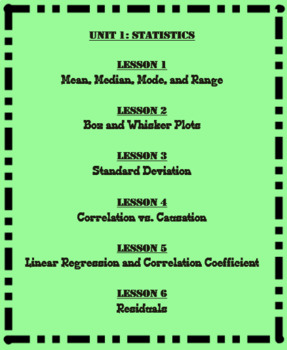
Unit 1-Statistics (Math 1)
This is the first Unit of the eight Units that I cover in Math 1. This unit is broken up in to six different lessons that are listed below. Each lesson includes a SMART Notebook presentation, a student note-taking guide, and an answer key. Also included in this unit are student flashcards, a test outline, and a 25 question multiple choice test.
Unit 1: Statistics
Lesson 1: Mean Median Mode Range Outliers and Skew
Lesson 2: Box and Whisker Plots
Lesson 3: Standard Deviation
Lesson 4: Correlati
Subjects:
Grades:
6th - 12th
CCSS:
Showing 1-24 of 129 results


