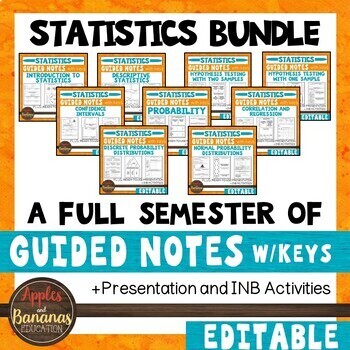
Statistics Interactive Notebook Activities & Guided Notes Bundle
- Zip
What educators are saying
Products in this Bundle (9)
showing 1-5 of 9 products
Also included in
- Price $198.77Original Price $283.95Save $85.18
Description
These Statistics products are flexible, editable, and can be used for in-person or distance learning. Each unit contains guided notes embedded with student practice problems (keys included), foldable activities, and a PowerPoint presentation for focused instruction. Choose what works best for your class/student and modify to make the content fit your needs. Notes are designed to clearly present the topics and reach all types of learners. Take the time and stress out of creating your own guided notes and presentations. There are many ways to use this engaging bundle.
The zip file includes BOTH editable, plain-font resources and ready-to-print, non-editable PDFs. Suggested use guides are included. These materials may be placed on an LMS for distance learning!
Interactive Math Notebook FORMAT – Includes 2 parts: guided notes and foldable activities. Piece the components together and students can create their own “math textbook” in a math journal.
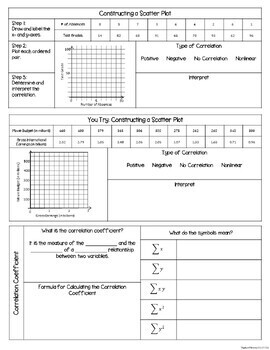
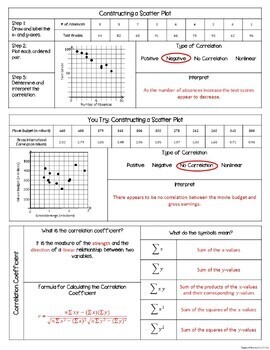
- The guided notes activities contain sample teacher answer keys. Example problems are solved on the sample teacher answer keys, but you can have your students use them over and over again with problems from your own curriculum. We have also added "You Try" activities in order to allow students to complete independent practice in between note-taking activities.
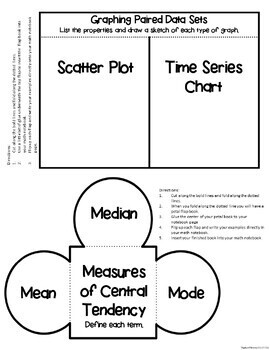
- The interactive notebook foldable activities include descriptions for use. We have not included specific examples for the interactive notebook activities. We like to give them to students for review so that they can show what they have learned and personalize their notes.
Presentation – This product contains a plain-font, no frills, PowerPoint presentation that you can use to present content to students whether you are in-person or remote. Modify the editable presentation to best fit your needs.
This bundle also contains a description of how to use the materials included and the suggested groupings for presenting the notes and interactive notebook activities with your students.
This product is perfect to use with any textbook or e-book curriculum and great for engaging all types of learners, including those with special needs.
We have a CCSS alignment guide to help you plan and prepare which you can access as a FREE download here:
Statistics Supplementary Materials and Alignment Guide
Scaffolded Note Sheets with Sample Teacher Keys for the following:
- Definition of Statistics
- Two Types of Data Sets
- Classifying a Data Set
- Identifying Data Sets
- Your Turn: Identifying Data Sets
- Parameter vs Statistic
- Distinguishing Between a Parameter and a Statistic
- Your Turn: Parameter or Sample Statistic?
- Branches of Statistics
- You Try: Identifying Descriptive and Inferential Statistics
- Types of Data
- You Try: Classifying Data By Type
- Data: Levels of Measurement
- Identifying Levels of Measurement
- You Try: Classifying By Type and Level of Measurement
- Guidelines for Designing a Statistical Study
- Methods of Data Collection
- You Try: Deciding on the Method of Data Collection
- Deciding on the Method of Data Collection
- Factors that Can Ruin Experimental Results
- You Try: Identifying Factors Effecting Results
- Techniques that Can Be Used to Get Unbiased Results
- You Try: Which Technique Is Being Described
- Validity Of An Experiment: Sample Size and Replication
- You Try: Sample Size And Replication
- Defining Key Terms: Census, Sampling, Sampling Error
- Commonly Used Sampling Techniques
- You Try: Determining Sampling Methods
- Frequency Distribution
- Identify Parts of the Frequency Distribution
- Guidelines for Constructing a Frequency Distribution from a Data Set
- Construct a Frequency Distribution
- Additional Features for a Standard Frequency Distribution
- Find the Midpoint
- Find the Relative Frequency
- Find the Cumulative Frequency
- Finding Midpoints, Relative Frequencies, and Cumulative Frequencies
- Construct a Frequency Histogram
- Construct a Frequency Polygon
- Construct a Relative Frequency Histogram
- Construct a Cumulative Frequency Graph (Ogive)
- Construct a Stem-and-Leaf Plot
- Construct a Stem-and-Leaf Plot (Two Rows for Each Stem)
- Construct a Dot Plot
- Construct a Pie Chart
- Construct a Pareto Chart
- Construct a Scatter Plot
- Construct a Time Series Chart
- Construct Your Own Graphs
- Measures of Central Tendency
- Find a Sample Mean
- Find the Median
- Find the Mode
- Finding Measures of Central Tendency
- Outliers
- Finding a Weighted Mean
- Finding the Mean of a Frequency Distribution
- The Shapes of Frequency Distributions
- Finding the Range of a Data Set
- Finding the Deviation of a Data Set
- Finding the Mean Absolute Deviation
- Finding the Population Variance and Standard Deviation
- Finding the Sample Variance and Standard Deviation
- Empirical Rule (Or 68-95-99.7 Rule)
- Solving Problems Using the Empirical Rule
- Chebychev’s Theorem
- Solving Problems Using Chebychev’s Theorem
- Finding the Standard Deviation for Grouped Data
- Using Midpoints of Classes to Find Standard Deviation
- Quartiles of a Data Set
- Interquartile Range (IQR)
- Construct a Box-and-Whisker Plot
- Deciles and Percentiles
- Standard Score or Z-Score
- Probability Experiment
- Simple Event
- Identifying Simple Events
- Fundamental Counting Principal
- Using the Fundamental Counting Principle
- Types of Probability
- Classical Probability
- Finding Classical Probabilities
- Empirical Probability
- Finding Empirical Probabilities
- Law of Large Numbers
- Subjective Probability
- Classifying Types of Probability
- Range of Probabilities Rule
- Probability of the Complement of an Event
- Conditional Probability
- Finding Conditional Probabilities
- Independent vs. Dependent Events
- Identifying Independent and Dependent Events
- Multiplication Rule for the Probability of A and B
- Mutually Exclusive Events
- Are the Events Mutually Exclusive?
- Addition Rule for the Probability of A and B
- Using the Addition Rule for the Probability of A and B
- Permutation
- Permutations of n Objects Taken r at a Time
- Distinguishable Permutations
- Permutation vs. Combination
- Combinations of n Objects Taken r at a Time
Discrete Probability Distributions
- Random Variables
- Discrete vs. Continuous Variables
- Discrete Probability Distributions
- How to Verify Probability Distributions
- Verifying Probability Distributions
- Probability Distributions (Example and Non Example)
- Mean, Variance, and Standard Deviation of a Discrete Random Variable
- Mean of a Discrete Random Variable
- Finding the Mean of Discrete Random Variables
- Variance of Discrete Random Variable
- Finding the Variance of Discrete Random Variables
- Standard Deviation of a Discrete Random Variable
- Finding the Standard Deviation Given the Variance
- Expected Value
- Finding the Expected Value
- Binomial Experiment
- Binomial Probability Formula
- Using the Binomial Probability Formula
- Constructing a Binomial Distribution
- Practice Constructing Binomial Distributions
- Finding Binomial Probabilities Using Formulas
- Graphing a Binomial Distribution
- Population Parameters of a Binomial Distribution
- Finding Mean, Variance, and Standard Deviation
- The Geometric Distribution
- Using the Geometric Distribution to Find Probabilities
- The Poisson Distribution
- Using the Poisson Distribution to Find Probabilities
Normal Probability Distributions
- Continuous Probability Distributions
- Normal Distribution
- Probability Density Function
- Mean and Standard Deviation of a Normal Curve
- Interpreting graphs of Normal Distributions
- The Standard Normal Distribution
- Guidelines for Finding Areas Under the Standard Normal Curve
- Finding the Area Under the Standard Normal Curve
- Finding Probabilities for Normal Distributions
- Practice Finding Probabilities for Normal Distributions
- Finding a z-Score Given an Area
- Practice Finding a z-Score Given an Area
- Finding a z-Score Given a Percentile
- Practice Finding a z-Score Given a Percentile
- Transforming a z-Score to an x-Value
- Finding an x-Value for a Given z-Score
- Finding a Specific Data Value
- Find the Sampling Distribution of Sample Means
- The Central Limit Theorem
- Using the Central Limit Theorem
- Probability and the Central Limit Theorem
- Finding Probabilities for Sampling Distributions
- Finding Probabilities for x and x ̅
- Normal Approximation to a Binomial Distribution
- Using a Continuity Correction
- Approximating a Binomial Probability
- Finding a Point Estimate
- Math Terms: Interval Estimate, Level of Confidence, Critical Values
- Matching Key Terms
- Level of Confidence and z_c
- Finding the Margin of Error
- Confidence Intervals
- Constructing Confidence Intervals
- Determining a Minimum Sample Size
- t-Distributions
- Finding Critical Values of t
- Constructing a Confidence Interval for a t-Distribution
- Normal Distribution vs. t-Distribution
- Finding a Point Estimate for p
- Constructing a Confidence Interval for p
- Finding a Minimum Sample Size to Estimate p
- Chi-Square Distributions
- Finding Critical Values for x^2
- Constructing a Confidence Interval for a Variance and Standard Deviation
Hypothesis Testing With One Sample
- Hypothesis Testing
- Statistical Hypothesis
- Stating the Null and Alternative Hypotheses
- Types of Errors
- Identifying Type I and Type II Errors
- Test Statistics
- P-Value of a Hypothesis Test
- Identifying the Nature of a Hypothesis Test
- Decision Rule Based on P-Value
- Interpreting a Decision
- Steps for a Hypothesis Test Using P-Values
- Writing the Hypotheses
- Interpreting a P-Value
- Finding the P-Value for a Hypothesis Test
- Using P-Values for a z-Test
- Hypothesis Testing Using P-Values
- Rejection Regions and Critical Values
- Finding Critical Values in a Normal Distribution
- Using Rejection Regions for a z-Test
- Testing Mean with a Large Sample
- Critical Values in a t-Distribution
- Test for a Mean (Sample less than 30,Standard Deviation Unknown)
- Testing a Mean with a Small Sample
- Using P-Values with t-Tests
- z-Test for a Proportion p
- Hypothesis Test for a Proportion
- Critical Values for X^2-Test
- X^2-Test for a Variance or Standard Deviation
- Using a Hypothesis Test for the Population Variance
- Using a Hypothesis Test for the Standard Deviation
Hypothesis Testing With Two Samples
- Independent and Dependent Samples
- Independent or Dependent?
- Null and Alternative Hypotheses for Two-Sample Hypothesis Test with Independent Samples
- Conditions Necessary to Perform a z-Test for the Difference Between Means
- Finding the Standardized Test Statistic and the Standard Error
- Two-Sample z-Tests for the Difference Between Means
- Conditions Necessary to Perform a Two-Sample t-Test for the Difference Between Means
- Finding the Standardized Test Statistic and the Standard Error
- Two-Sample t-Test for the Difference Between Means (Variances NOT Equal)
- Two-Sample t-Test for the Difference Between Means (Variances Equal)
- Conditions Necessary to Perform a Two-Sample Hypothesis Test with Dependent Samples
- Using the t-Test for the Difference Between Means (Dependent Samples)
- Conditions Necessary to Perform z-Test for the Difference Between Proportions
- Sampling Distributions for the Difference Between Sample Proportions
- Two-Sample z-Test for the Difference Between Proportions: Standardized Test Statistic
- Two-Sample z-Test for the Difference Between Proportions
- Correlation
- Types of Correlation
- Constructing a Scatter Plot
- Correlation Coefficient
- Calculating the Correlation Coefficient
- Using a Table to Test a Population Correlation Coefficient p
- The t-test for a Correlation Coefficient
- Things Researchers Must Consider When Two Variables are Strongly Correlated
- Using the t-Test for Correlation Coefficient
- Regression Lines (Lines of Best Fit)
- The Equation of a Regression Line
- Finding the Equation for a Regression Line
- Three Types of Variation about a Regression Line
- Coefficient of Determination
- Finding the Coefficient of Determination
- Standard Error of Estimate
- Finding the Standard Error of Estimate
- Prediction Interval
- Constructing a Prediction Interval
Related Products:
**Full-year Curriculum Packs**
Algebra 1 Curriculum Pack BUNDLE
Geometry Curriculum Pack BUNDLE
Algebra 2 Curriculum Pack BUNDLE
Scaffolded Notes/Interactive Notebook Bundles
Pre-Calculus Add on for Algebra 2 INB Bundle
High School Math Interactive Notebook Bundle (Algebra 1, Geometry, Algebra 2)
Student Practice Pages Bundles
Algebra 1 Student Practice Pages Bundle
Geometry Student Practice Pages Bundle
Algebra 2 Student Practice Pages Bundle
High School Math Student Practice Pages Bundle (Algebra 1, Geometry, Algebra 2)
Assessment Bundles
High School Math Assessment Bundle (Algebra 1, Geometry, Algebra 2)
**If you like what you see, please click on the "Follow Me" star to learn about new products, sales, and more!


