112 results
5th grade critical thinking graphing resources for Microsoft Excel
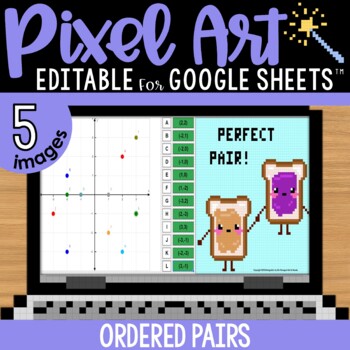
Ordered Pairs Graphing Coordinate Plane Pixel Art Math | 5 Images | Editable
Ordered pairs mystery pixel art with a doubles / perfect pairs theme! Have students practice finding the location of a coordinate pair on a graph to AUTO-GENERATE one of 5 pixel art images in Google™ Sheets (or Microsoft Excel™) plus a "secret message."★ Low Prep: Just assign the sheet in Google Classroom. Each sheet includes all 5 images; students click the tabs at the bottom to advance to the next pixel image. There are 12 math problems per image to solve.★ Differentiated: Includes 4 versions
Grades:
4th - 5th
Types:
Excel Lessons - Creating Charts
No Prep! These lessons are great as a first Excel Chart lesson or for students already a little familiar with creating charts. Students love the data for these charts because the data is centered around things they love – their cell phones! In Lesson 1, students will create 5 different charts from step-by-step directions which include Chart Titles, Chart Styles, Axis Titles, Data Labels, and Moving Chart to its own Sheet.In Lesson 2, students will create 5 charts from provided data as well as ch
Grades:
5th - 12th
Types:
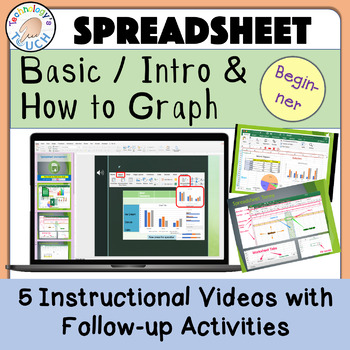
Spreadsheet - Basics Introduction & Graphing (Excel and Google Sheets)
This lesson guides students via animation and a tutorial video before completing the assignments. This is completely paperless with no prep, and lessons are done on either Microsoft Excel or Google Sheets. Students learn to enter data and start graphing. This resource is intended for learners first starting out or those who need a reminder on using spreadsheets or creating graphs. If you want your students' research papers to include eye-catching graphs, give this lesson a try. Start the slides
Subjects:
Grades:
1st - 8th
Types:
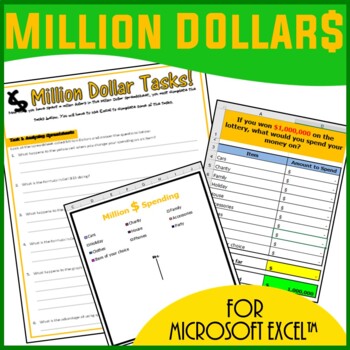
Excel Spreadsheets Million Dollars Activity
This resource allows students to understand the following: How graphs change when spreadsheet data is alteredUse of SUM() functionsHow graphs are madeComponents of a graphAdvantages of spreadsheets over pen and paper methodsStudents use this resource to understand how altering data in spreadsheets allow graphs to change. They understand such concepts by trying to spend a Million Dollars in a minute. Students are then expected to complete the associated worksheet which accompanies the spreadsheet
Grades:
5th - 12th, Adult Education
Types:
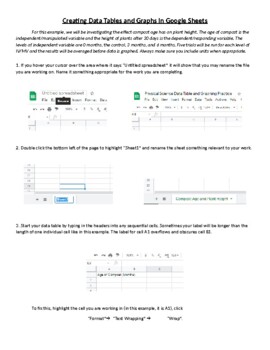
Creating Data Tables and Graphs in Google Sheets
This is an activity that walks students through the process of organizing and entering data into a data table and then using that data to generate line, bar, and pie charts. Once the graphs are generated, the process of formatting and editing the different parts of each graph is explained.
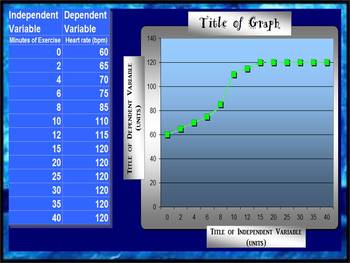
LINE GRAPH MAKER (AUTOMATIC)
This spreadsheet allows you to insert your independent and dependent variables into a chart and voila!... a line graph is generated as you enter in each piece of new data! Students love to take their data from a lab and watch as a graph is made right before their eyes! You can change all of the titles on the chart and the graph to suit your classes laboratory experiment needs! Students can easily print out their data to include in their lab reports!
Grades:
2nd - 12th
Types:
Weather Tracking in Excel
Compatible with Google Sheets, Google Classroom, or as a stand-alone file on a PC, this product is a must have for any teacher comparing weather conditions in multiple locations!
BEFORE YOU BUY: This file is part of a larger unit. Save yourself money by purchasing the Super Science Set for Weather and Climate nstead of buying each file separately.
Purchased alone, you get:
⭐ An Excel workbook that enables students to track the weather for 5 different locations as a whole class or individ
Subjects:
Grades:
4th - 8th
Types:
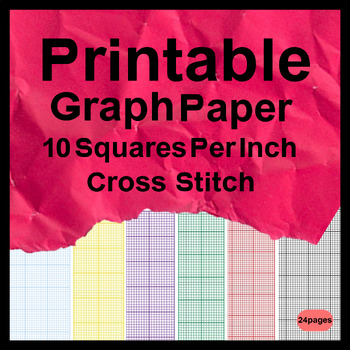
Printable Graph Paper 10 Squares Per Inch Cross Stitch
Printable Graph Paper 10 Squares Per Inch Cross Stitch - Grid paper is essentially the type of paper most commonly used for drawing and sketching purposes. It is widely used for making plan charts, designing websites, developing home ideas and so forth. A great deal of businesses who need to produce a company card, business brochures, catalogues, brochures, and so forth need this kind of graph paper.
Subjects:
Grades:
5th - 12th
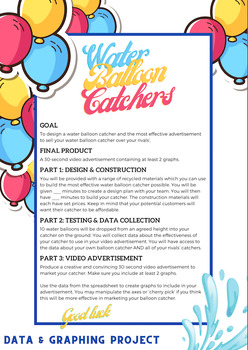
Water Balloon Catcher Project - Data and Graphing - Mathematics
Transform your maths classroom into a dynamic hub of learning with this captivating data and graphing project! Designed for upper primary/middle school students, this hands-on and inquiry-based activity ensures an immersive experience in mastering data interpretation, chart creation, and understanding the role of data and graphs in advertising.In this engaging project, students will: Explore Data: Collaborate in teams to design and construct a Water Balloon Catcher using recycled materials, each
Subjects:
Grades:
5th - 9th
Types:
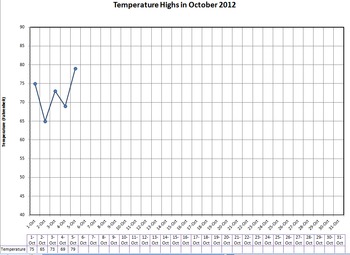
Graph Daily Temperature - with handout
Lots of downloads, are there any comments or votes for me? :)
Type in the daily temperature on your computer with your students and it will automatically graph it for you as you type. You can pre-print the monthly graph for everyone in your class and they can follow along and graph with you. I use it with calendar math or other daily activities.
Great for explaining the scales of a graph and practicing accuracy in graphing and using rulers to connect lines. Look for trends in weather and a
Subjects:
Grades:
3rd - 6th
Types:
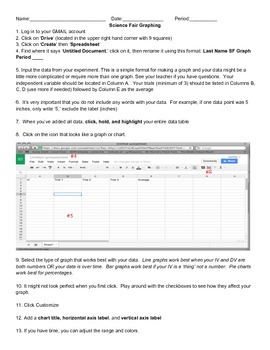
How To Graph Using Google Spreadsheets
This is a step-by-step guide on how to use Google Spreadsheets for students in grades 5-12. Use this as a resource when guiding students through the process. Included with the directions is sample data for students to use when practicing graphing. Perfect for science experiments and science fair!
Subjects:
Grades:
5th - 12th
Types:
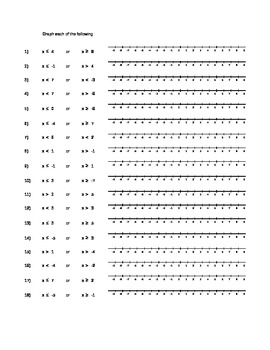
Compound Inequality Graphing Practice
This excel spreadsheet includes a sheet of practice for both AND and OR compound inequalities. There are also three sheets of blank number lines, so that a teacher could write their own inequalities for students to graph.
Grades:
5th - 9th
Types:
Excel Graphing Summer Fun with Digital Student Directions
The last marking period of the school year can be a challenging time to keep students engaged…they’re thinking about summer…you’re thinking about summer…#embraceitThis Summer Fun Excel project can be a perfect way to:* integrate technology* extend and enrich a math topic of study* introduce students to creating sheets and charts using ExcelProject file includes:* teacher notes/ classroom management suggestions* digital survey, using a Google Form, to collect summer activities data* digital stude
Subjects:
Grades:
3rd - 6th
Types:
Manage Sports Statistics in Google Drive / Google Sheets - Activity
Use Google Sheets to analyze sports data
This activity lets students practice several fundamental spreadsheet skills, including:
-renaming documents
-adding formulas
-inserting / formatting charts
Screenshots demonstrate how to do all of the above in Google Sheets, the spreadsheet application in the Google Drive suite. You can add additional statistics to customize the assignment for your students and adjust the level of difficulty.
Aligned to the following Massachusetts Technology Literacy
Grades:
5th - 8th
Types:

The Lion, the Witch, and the Wardrobe - Parallels between Narnia and the Bible
www.atravelingtutor.com
"But there I have another name. You must learn to know me by that name. This was the very reason why you were brought to Narnia, that by knowing me here for a little, you may know me better there.”
A student read this to me from Voyage of the Dawn Treader and then asked, "Do we ever find out who Aslan is?"
I incorrectly assumed it was clear that C.S. Lewis' Aslan was, in type, Jesus. I read The Lion the Witch and the Wardrobe to the students and created this activity
Grades:
4th - 6th
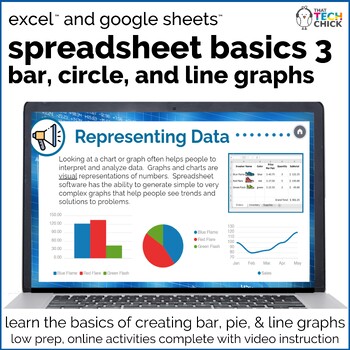
Spreadsheet Basics 3 - Graphing
Help your students increase their ability to access and analyze information by learning to create graphs from computer spreadsheets with Spreadsheet Basics - Graphing. This resource is no prep, with narration and instructional videos that will help you foster critical thinking and problem solving skills. The only thing your students will need is the link to the resource to begin learning important new skills.Please look at the Preview and Video to take a closer look!This online activity is bro
Grades:
4th - 7th
Also included in: Custom Bundle for Danielle A.
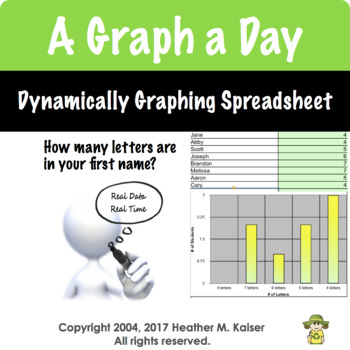
Daily Graph
If you want to integrate technology in a meaningful way, try using the daily graph questions that generate a graph in real time as students respond. This fully editable product works in Numbers, Excel, and Google Sheets.
When downloaded, this Excel spreadsheet contains 180 questions for students to answer. The teacher types their student roster 1 time. As students respond the graph is created dynamically. Teachers can customize the prompts and can upload the file as a Google Sheet that can
Grades:
3rd - 5th
Types:
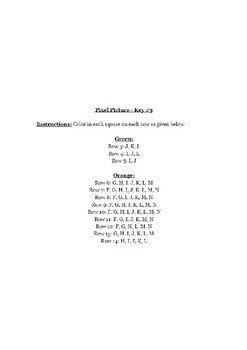
Halloween Pixel Art Excel/Google Sheets
Microsoft Excel activity to use upper elementary or middle school students? This great lesson incorporates art as students learn the basics of Microsoft Excel.These are also fun lessons to use if you just need something for a one day lesson.
This download includes:
1. Teacher & Student Resources
2. Excel Template for Pixel Art
3. Legends and Sample Pictures for 3 Halloween Pictures
When completed let students make their own pictures, they will love it!
I've used this with 6th and 7th gra
Subjects:
Grades:
5th - 9th
Types:
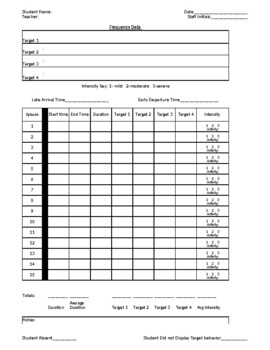
Behavior Frequency Rate Chart w/ Target, Intensity, Duration, BIP chart/Summary
Behavior Frequency Rate Chart (dates and chart cant be edited and dates changed to current year or target)--Daily Sheet-Date Entry-Intensity Chart-Duration Chart-Target Charts-BIP Evaluation printout -BIP write upSee preview for description Excel format for editing - tabs at bottom of page for easy change of view and data entry
Subjects:
Grades:
PreK - 12th

Google Sheets Coding for Beginners | Tech Challenges
PURPOSE: This activity provides students with fifteen different coding-related challenges in Google Sheets. It is designed as a self-paced set of tasks to be completed through exploration of the vast library of built-in functions within Google Sheets. Not only will students be problem solving to figure out the tasks, they will also be developing skills in using the Google Suite along the way.WHAT’S INCLUDED:This product contains:✏️ 15 increasingly difficult challenges using functions for Google
Grades:
4th - 7th
Types:
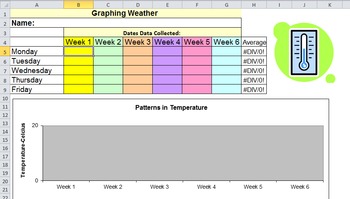
Weather Graph
This Excel spreadsheet can be used as a whole group activity, or as an individual activity. Students enter daily temperature. The sheet automatically graphs the data. There are seven sheets. One sheet is for data collected daily over six weeks. The other sheets are from collecting data each day on a monthly basis. The monthly sheets are automatically set to average the weekly temperature. Some cells are locked to prevent younger students from accidently deleting labels, etc. Each sheet can be pr
Subjects:
Grades:
K - 7th
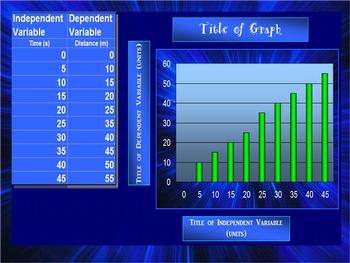
BAR GRAPH (AUTOMATIC)
This spreadsheet allows you to insert your independent and dependent variables into a chart and voila!... a bar graph is generated as you enter in each piece of new data! Students love to take their data from a lab and watch as a graph is made right before their eyes! You can change all of the titles on the chart and the graph to suit your classes laboratory experiment needs! Students can easily print out their data to include in their lab reports!
elementary science class, middle school sc
Grades:
2nd - 12th
Types:
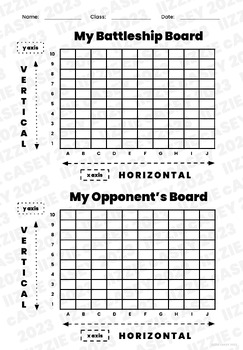
Coordinate Grids for Battleship and Spreadsheet Practice
I used this resource to teach 2nd and 3rd graders how spreadsheets and coordinate grids work! We played Battleship with them.
Subjects:
Grades:
2nd - 6th
Types:
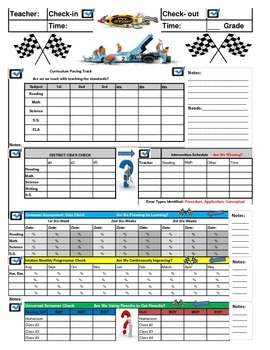
The PIT-STOP CHECK-IN Goal Folder System for School Administrators:
At times it appears that we are always in a race to master rigorous content standards at every grade-level. As administrators we must actively monitor our classrooms to ensure that adequate progress is occurring school-wide. In an effort to ensure that our teachers are continuously improving academically, I designed a check-in goal folder system for teachers to confirm that as a campus we are maintaining our goal focus towards continuous improvement. In order to do so, we are having every inst
Grades:
PreK - 8th
Showing 1-24 of 112 results

