23 results
5th grade Common Core HSS-ID.A.2 resources
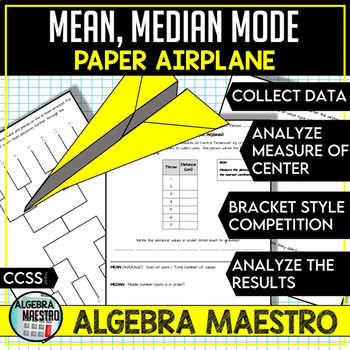
Measure of Center: Paper Airplane Activity
Students can further explore the meaning of statistical measures of center: mean, median, and mode by experimentation. This is a fun activity to explore measures of center. I use this activity with my Algebra 1 students when we start our descriptive data unit before we start talking about graphical displays (i.e. box plots, histograms, etc.). We compare measures of centers and analyze when it is appropriate to use a specific measure.Included:1. Collect data from Paper Airplane 2. Bracket t
Subjects:
Grades:
5th - 11th
Types:
CCSS:
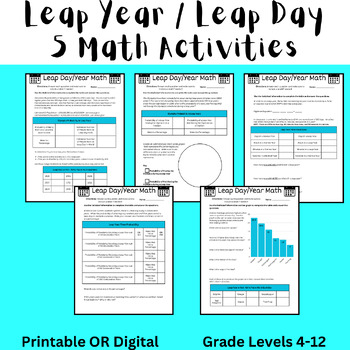
Leap Day (Leap Year) 2024 Math Activity (Algebra and Data) Digital or Printable
These 5 activities are fun NO PREP math activities to do to celebrate Leap Day 2024 (Leap Year 2024). The activities can be completed as 5 separate pages or as a 5 page packet. There is a customizable digital resource (Google Document) and a printable resource (Canva) that contain the same directions and activity. This was designed for students in middle school, but could be used for upper elementary and high school students in Pre Algebra, Pre-Algebra, or Algebra. In this assignment, students
Subjects:
Grades:
4th - 12th, Higher Education, Adult Education
Types:
Also included in: Leap Year (Leap Day) 2024 Bundle - Math, Reading, Writing, and Trivia
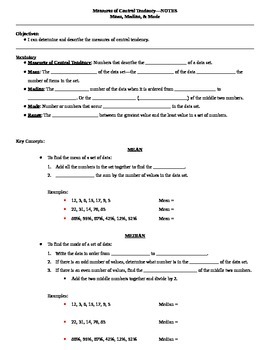
Measures of Central Tendency Guided Notes
These are guided notes for a lesson on measures of central tendency including mean, median, mode, and range. There are several examples in the notes and the same data sets are used to show each measure of central tendency.I have also included a teacher key to show you what to fill in the blanks as your students follow along.To use these notes, I simply projected them onto my whiteboard, gave the students their blank copies, and had them follow along and write what I wrote. This works great when
Subjects:
Grades:
5th - 12th
CCSS:
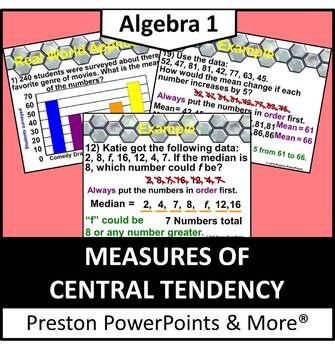
(Alg 1) Measures of Central Tendency in a PowerPoint Presentation
Algebra 1 Measures of Central Tendency in a PowerPoint PresentationThis slideshow lesson is very animated with a flow-through technique. I developed the lesson for my Algebra 1 class, but it can also be used for upper level class reviews. This lesson teaches how to find the mean, median, and mode of a data set, identify and remove outliers, explain the effects of changing values in data sets, and solve real-life data problems using graphs to organize as the most liked movie genre.This lesson h
Grades:
5th - 9th
CCSS:
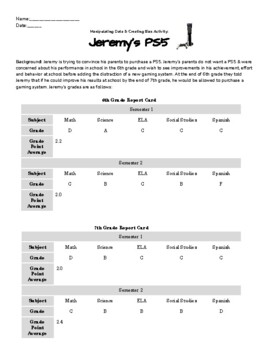
Manipulating Data & Creating Bias Activity
Manipulating Data & Creating Bias Activity: Teach your students about how charts and statistics can be skewed; and real numbers can reflect bias with this fun project! Students are given a role (either Jeremy or his parents) and have to use two pieces of data from Jeremy's 6th & 7th grade report card to argue for or against his deserving of a PS5!Students get to be creative & make cross-curricular connections to ELA as they use logical fallacies & skewed graphs to make their argu
Subjects:
Grades:
4th - 11th
Types:
CCSS:
NGSS:
HS-ETS1-4

Standard Deviation Printable Activities - Mystery Pic & Joke Herowork Worksheets
Heroes are not made overnight, they are developed with practice. They need to do their Herowork! Upgrade your standard deviation homework and classwork options with assignments that motivate your kiddos to battle all the way to the end of the page!Herowork is designed to be engaging repeated skill practice with a twist. With two worksheet for each topic, you can use both or let students make a choice. The two different worksheets are Riddlers and Jokers. To Solve the Riddlers, students must solv
Subjects:
Grades:
5th - 12th
Types:
CCSS:
Also included in: Measures of Center & Variance Unit Bundle - Distance Learning Compatible

Mean Absolute Deviation No Prep Lesson
Mean Absolute Deviation: This packet contains worksheets on mean absolute deviation. These worksheets are great for differentiation and remediation.
This packet includes:
Anticipation Guide
Anticipation Guide Answer Key
Graphic Organizer
Error Analysis
Error Analysis Answer Key
Mean Absolute Deviation Worksheet
Mean Absolute Deviation Worksheet Answer Key
Mean Absolute Deviation Extra Practice Worksheet
Mean Absolute Deviation Extra Practice Worksheet Answer Key
Mean Absolute Deviation Ticket
Subjects:
Grades:
5th - 12th, Adult Education, Staff
Types:
CCSS:
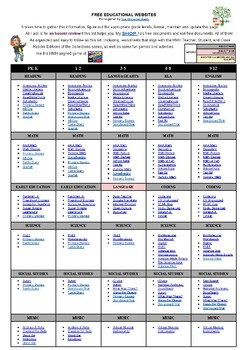
FREE EDUCATIONAL WEBSITES LIST 4 ALL GRADES K-12 AND SUBJECTS + TEACHER RESOURCE
Sometimes, you just need a list of websites for everyone. Here it is. FREE EDUCATIONAL WEBSITES Put together by Teach Me, Maria!It takes time to gather this information, figure out the appropriate grade levels, and format, maintain, and update this page. All I ask is for an honest review if this list helps you.
Subjects:
Grades:
PreK - 12th, Staff
Types:
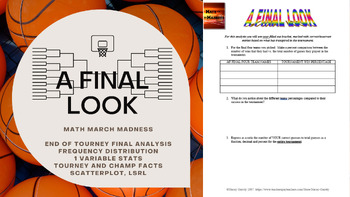
Math March Madness - A Final Look (Freq Distributions, Stats, Regression Lines)
Fill out a bracket, watch the tournament unfold and then mathematically analyze how you did! This activity is flexible enough to be used for a variety of levels. I have used all 6 pages for an AP Statistics class, and have used pages 1 through 5 for an Algebra or Algebra 2 class. You could even use it in lower levels as long as you are covering percents, and basic stats like mean, median, mode and graphing. The document is editable so you can adjust/delete to tailor to the level of statistic
Subjects:
Grades:
4th - 12th, Higher Education
Types:
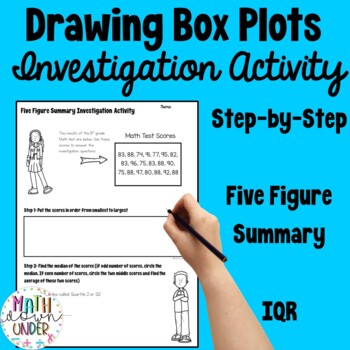
Drawing Box and Whisker Plots Investigation + Practice
Your students will love this three page activity that guides them through the steps to create a box and whisker plot. Calculating the Five Figure Summary (min value, Q1, Q2, Q3, and max value), Interquartile Range, and then drawing Box and Whisker Plots are all included. Have a look at the preview file to get a better idea of what this product looks like. Follow my store and thank you for your support!Want the digital, Google Slides version? Find it here:Related Products• Box Plots Digital Inves
Subjects:
Grades:
5th - 12th
Types:
CCSS:
Also included in: Box Plots - Print and Digital Activity Bundle
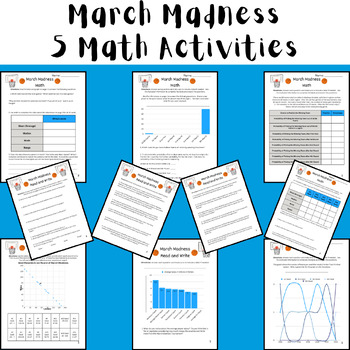
March Madness Men's Math - 5 Activities (Data + Graphs) Printable & Digital 2024
These 5 activities are fun NO PREP math activities to do to celebrate March Madness! The activities can be completed as 5 separate activities, stations, or as a multi-page packet. There is a fully customizable digital resource (Canva Template) and a printable resource (Canva) that contain the same directions and activity for each resource. This was designed for students in middle school, but could be used for upper elementary and high school students in Pre Algebra, Pre-Algebra, or Algebra.In th
Subjects:
Grades:
3rd - 12th
Types:
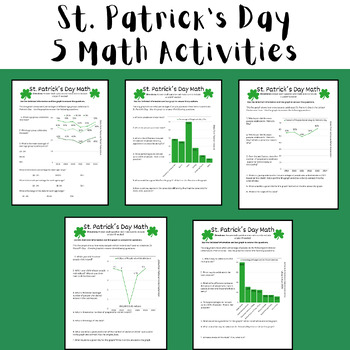
St. Patrick's Day Math Activities (Test Prep Data Analysis) Printable or Digital
These 5 activities are fun NO PREP math activities to do to celebrate St. Patrick's Day. The activities can be completed as 5 separate pages or as a 5 page packet. There is a customizable digital resource (Canva Template) and a printable resource (Canva) that contain the same directions and activity. This was designed for students in middle school, but could be used for upper elementary and high school students in Pre Algebra, Pre-Algebra, or Algebra.In this assignment, students are asked to:Gra
Subjects:
Grades:
3rd - 12th, Staff
Types:
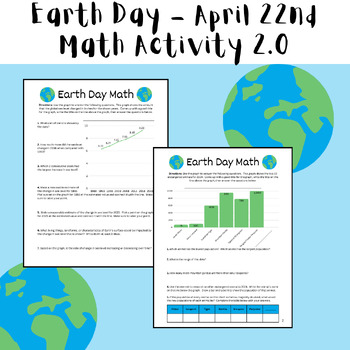
Earth Day 2024 Middle School Math Activity (Printable+Digital)
This NO PREP middle school math activity can be used as a printable or digital resource! It involves statistics about real-world data including endangered animals and the change in sea levels over time. This activity was designed for middle school, but could be used for upper elementary (with scaffolding) or high school students in Pre-Algebra, Pre Algebra, Algebra, or Geometry.Math Skills Involved in This Activity:RangeData AnalysisBar GraphLine GraphIncrease vs Decrease on GraphsWord Problems
Subjects:
Grades:
4th - 10th
Types:
CCSS:
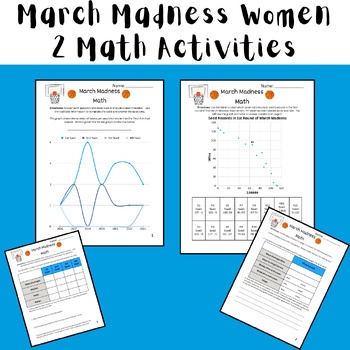
March Madness Math - Women's Basketball Data Analysis Printable/Digital 2024
These 2 activities are fun NO PREP math activities to do to celebrate March Madness! The activities can be completed as 2 separate activities, stations, or as a multi-page packet. There is a fully customizable digital resource (Canva Template) and a printable resource (Canva) that contain the same directions and activity for each resource. This was designed for students in middle school, but could be used for upper elementary and high school students in Pre Algebra, Pre-Algebra, or Algebra.In th
Subjects:
Grades:
4th - 10th
Types:

All of the Common Core Math Standards Checklists
This is a bundle of checklists for Math Common Core Standards for all of the grades (K-12) on an excel spreadsheet with 5 columns for data input. These standards are organized in their own sub-domains to coordinate lessons. Please see my free file for an example.
Subjects:
Grades:
K - 12th
Types:
People Perfectly in Proportion: The Golden Ratio
Zip File includes - PDF and editable documentLesson Setup: This lesson can be used for students at all developmental levels. Measuring with a ruler, error analysis, and proportional thinking are a few of the skills this lesson practices. Groups can be made based upon skill requirements. Lower functioning students can perform measurements and watch higher performing students do calculations. Result could also be presented by a possible third student - if you want to do trios as opposed to pa
Subjects:
Grades:
3rd - 12th, Adult Education
Types:
A Fun Introduction to Probability
This product contains fourteen pages that introduce probability by graphing the LEGOs and comparing the number of studs on LEGO bricks. These statistics will be figured in fractions, decimals and percentages. Graphing will be done on bar graphs and pie graphs. The worksheets are colorful and engaging for students. Students will learn to find the mean, median and mode of different numbers of studs on LEGO bricks. Students will find their own statistics and combine them with the statistics of ot
Subjects:
Grades:
4th - 9th
![Preview of HS [Remedial] Applied Math I Sampler: (textbook-less course)-40 pgs](https://ecdn.teacherspayteachers.com/thumbitem/Applied-Math-I-Sampler-to-help-inform-curriculum-1041734-1643631898/original-1041734-1.jpg)
HS [Remedial] Applied Math I Sampler: (textbook-less course)-40 pgs
The sampler is comprised of 132 problems representative of 66 topics from grade 3 to HS. They are IN THE SAME ORDER in which I teach Applied Math I at my charter school. The course was designed and created when it became obvious that many of my students could not solve word problems and were ill-prepared for their junior-level state testing that has come to be the all-important barometer determining whether or not students can graduate. This course is the result of a lot of experimentation and t
Subjects:
Grades:
3rd - 10th
Types:
Dress Code Data Analysis and Visualization
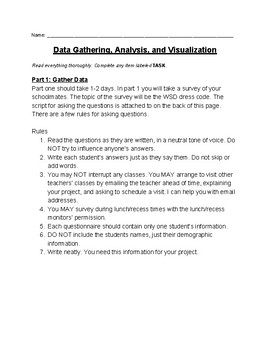
If your school has a dress code, use this Project Based Learning packet to teach your students about gathering, analyzing, and visualizing authentic data. The packet covers calculating percentages, measures of central tendency (mean, median, mode) and range, analyzing multiple data sets in conjunction to determine correlations, and visualizing data for improved analysis and communication. The packet is written to be mostly self guided. It is great as an enrichment project or as a whole class pro
Subjects:
Grades:
5th - 9th
Types:
CCSS:
Get Sporty with Interquartile Ranges
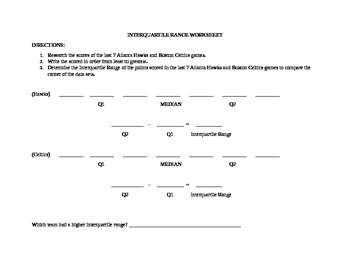
Do you need help teaching your students about the "middle 50" in a data set? Introduce Interquartile Ranges in a fun and engaging way with this worksheet. Students will analyze the scores of the two teams and determine which has the best point spread. You can even customize the teams to feature your favorites! ♯ Please review TOU before purchasing.Be sure to look at the Preview and Thumbnails to ensure this activity aligns with your students/curriculum. If you have any questions, please contact
Subjects:
Grades:
5th - 8th
Types:
CCSS:

Standard Deviation Activity - Printable & Digital - Saudi Arabia Adventure
This resource is a play on the Adventure books of your childhood with standard deviation. An Adventure assignment allows students choice of which problems they practice. After each problem they receive a clue about the mystery country they are exploring. By the end, hopefully they will have enough pieces of the puzzle to guess where in the heck they are. Student choices will affect the types of clues they will receive and allows for additional practice for enrichment or remediation. In my experi
Subjects:
Grades:
4th - 7th
Types:
CCSS:
Also included in: Measures of Center & Variance Unit Bundle - Distance Learning Compatible

Data Discovery
Use this activity at the beginning of the school year in Science class to teach and refine data collection skills, build conversations about data analysis, and graphs vs. tables. Students will use classroom items and collect data from their peers to determine how to graph and organize information they have collected. Scientific method, data analysis, or an icebreaker for science.
Subjects:
Grades:
5th - 9th
Types:
CCSS:
NGSS:
MS-ETS1-4
, 3-5-ETS1-2
, MS-ETS1-3
Measures of Center Foldable (mean, median, mode)
This foldable has 3 tabs, each with explanations and completed examples for the three measure of center: mean, median, and mode.
Subjects:
Grades:
5th - 9th
CCSS:
Showing 1-23 of 23 results

