6 results
Not grade specific Common Core HSS-ID.A.2 resources
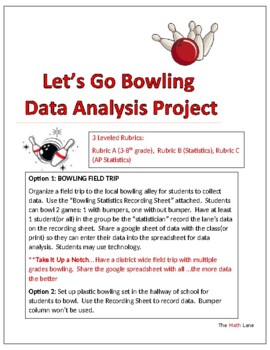
Let's Go Bowling Statistics STEM Project & Field Trip (3-12 and AP Stat)
Great END OF YEAR project. Get ready to strike up some fun with your students on a field trip to the bowling alley or right in your own hallway with a plastic bowling set! This isn't just any ordinary field trip - it's a real-world data collection extravaganza. 3 different leveled rubrics (Grade 4-10, Statistics, AP Statistics) so students can analyze the data based on their math knowledge. Students will be able to practice creating and analyzing graphical displays, scatterplots, construct c
Subjects:
Grades:
Not Grade Specific
Types:
Also included in: High School Statistics Project Bundle
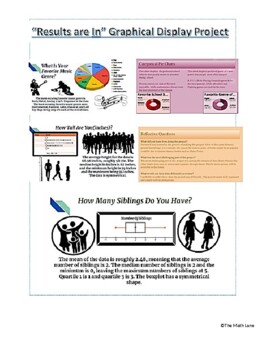
"The Results are In" Graphical Display Stats End of Year Project (All Grades)
Get ready to take your data analysis skills to the next level with our Graphical Display Project! Designed for students who want to create visually stunning displays of their data, this project allows you to not only collect data using Google Surveys, but also analyze and present it using Google Sheets. With detailed instructions, project examples, and a comprehensive rubric included, you'll have everything you need to create professional-looking graphical displays of both numerical and categori
Subjects:
Grades:
Not Grade Specific
Types:
CCSS:
Also included in: High School Math Projects (Algebra II and Statistics) STEM No prep
The Data Driven Teacher
Your classroom is full of data points of which you can be made aware. The purpose of this book is to set out the methods by which you, a teacher practitioner, can collect, analyze, and use data in the context of a teaching and learning environment. It focuses on helping you develop tools to model classroom data from the following components of the classroom: student relationshipsclassroom disciplineclassroom discoursecurriculum developmentassessment of masteryThe methods this book presents to
Grades:
Not Grade Specific
Types:
CCSS:

Teaching with Baseball Statistics
I use this activity to teach my science students how to model an idea using data. Students learn to predict the outcomes of a baseball pitcher based on their last 3 years of stats. Students learn to analyze their data and determine trends in the data. Students also learn to compare data from their pitcher to other students' pitchers (collaboration). Students also must be able to/learn to accurately graph their data. There is also a research component as students must research their pitcher's
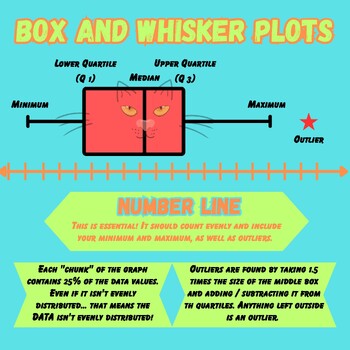
Box Plot Poster
Box plot poster showing where each number of the 5 number summary goes on a number line and describes how to find outliers using 1.5 IQR rule
Subjects:
Grades:
Not Grade Specific
Types:
CCSS:
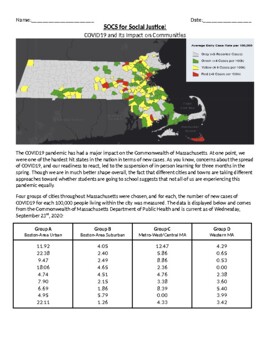
SOCS for Social Justice: Analyzing the Impact on COVID-19 in Massachusetts
The COVID-19 pandemic has undoubtedly impacted Massachusetts, with over 10,000 dead (as of the time this was posted) and hundreds of thousands sickened. What's worse, as epidemiologists have pointed out, is that the pandemic may not be impacting everyone equally. Some have observed that people of color and/or people from low-income communities may be disproportionately impacted. But can we use data to show whether or not this is true?In this activity, students use REAL data from the Massachusett
Subjects:
Grades:
Not Grade Specific
Types:
CCSS:
Showing 1-6 of 6 results

