19 results
Free 8th grade statistics posters
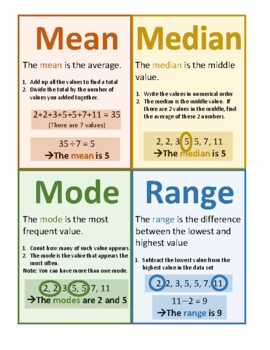
Mean Median Mode Range Poster Notes Anchor Chart
The PDF poster describes mean, median, mode, and range in an easy-to-understand and visual way. Enjoy!Check out my other posters here:STEM: Women in STEM Insp. Quotes, Women in STEM, Careers, Heroes Timeline, Inspirational Quotes from STEM HeroesABCs of Math: STEM Innovations, Amazing STEM facts, Careers, Shapes, in Nature Modern Style, in Nature Vintage Style, in Everyday LifeMath Vocabulary Alphabet: Elementary, Middle School, High SchoolMath in Art: Set A, Set B, Big BundleMath Modelling: Se
Subjects:
Grades:
5th - 9th
Types:
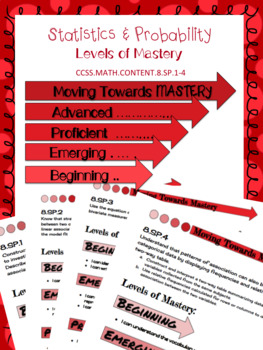
8.SP Scatter Plot & Two-Way Table Levels of Mastery
This product was created to use as an introduction to teaching the eighth grade statistics and probability standards. It allows students to evaluate themselves throughout the process of teaching the standards. It can be printed and provided to each student or printed as posters to be hung in the classroom for easy reference.
Levels of mastery are:
→ Beginning
→ Emerging
→ Proficient
→ Advanced
Levels of Mastery Posters:
★ 8.SP.1 Constructing & Interpreting Scatter Plots
★ 8.SP.2 Line of
Subjects:
Grades:
8th, Higher Education
Types:
CCSS:
Also included in: 8th Grade Math Common Core Growing Bundle
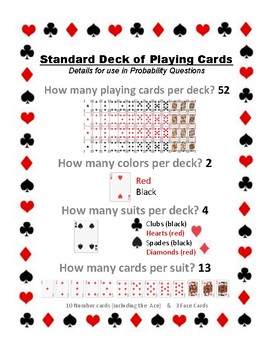
Deck of Playing Cards info, Journal Insert for Probability Questions
When teaching my 7th graders probability, I was surprised to find that many did not know what types of cards where in a standard deck of playing cards. So I created this insert for their journals as a reference.
The inserts can be printed in color or black and white. There are three files within the zip file. They include a full page copy for ease of projection, 2 per page copy and 4 per page copy for the students' journals. This gives you the freedom to decide how large you want their journal
Subjects:
Grades:
5th - 8th
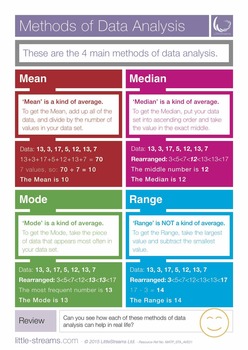
Methods of Data Analysis | Poster on Mean, Median, Mode and Range
This is a simple and completely FREE poster on the four common methods of data analysis. It states simply how to find each.
You may also like:
Mean, Median and Mode Bingo
Averages Follow Me Cards
Mean Wars Averages Card Game
If you have any comments or suggestions, and to stay updated please follow us or take a look at our Facebook Page
Please click here to visit our website for more information about LittleStreams
Subjects:
Grades:
5th - 8th, Adult Education
Types:
CCSS:
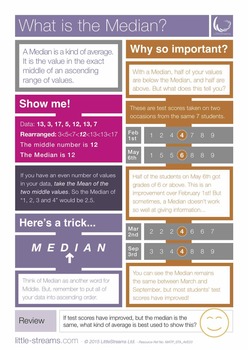
What is the Median? | Free Poster
A completely FREE poster on the Median, it's benefits and its downsides.
You may also like:
Mean, Median and Mode Bingo
Averages Follow Me Cards
Mean Wars Averages Card Game
If you have any comments or suggestions, and to stay updated please follow us or take a look at our Facebook Page
Please click here to visit our website for more information about LittleStreams
Subjects:
Grades:
5th - 8th, Adult Education
Types:
CCSS:
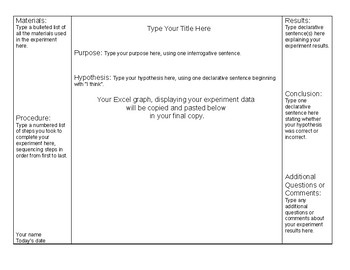
Scientific Method Mini Trifold Board Template
Students can create mini trifold boards, to display any science experiment using the Scientific Method format with this Word document template.
Teachers can save and share this with their students using public file storage available on school servers, Google Drive, etc.
This classroom-tested template was used for a Valentine Candy Heart Investigation project I developed. Student sample work may be viewed on my classroom web site here:
http://www.mrsdingman.com/Vday_Mini_Tri-Fold_Julia.pdf
htt
Subjects:
Grades:
5th - 8th
Types:
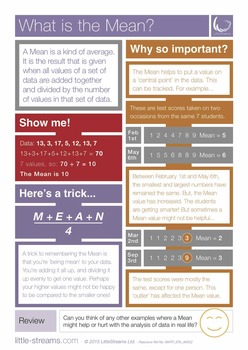
What is the Mean? | Free Poster
A completely FREE poster on what the Mean in statistics is, why it's important and it's properties.
You may also like:
Mean, Median and Mode Bingo
Averages Follow Me Cards
Mean Wars Averages Card Game
If you have any comments or suggestions, and to stay updated please follow us or take a look at our Facebook Page
Please click here to visit our website for more information about LittleStreams
Subjects:
Grades:
5th - 8th, Adult Education
Types:
CCSS:

What is the Range? | Free Poster
A completely FREE poster on the Range in data analysis, it's benefits and its downsides.
Click here to take a look at our popular Averages Card Game
And our new Statistics Bingo game
If you have any comments or suggestions, and to stay updated please follow us or take a look at our Facebook Page
Please click here to visit our website for more information about LittleStreams
Subjects:
Grades:
5th - 8th, Adult Education
Types:
CCSS:

What is the Mode? | Free Poster
A completely FREE Poster on the Mode, it's benefits and its downsides.
You may also like:
Mean, Median and Mode Bingo
Averages Follow Me Cards
Mean Wars Averages Card Game
If you have any comments or suggestions, and to stay updated please follow us or take a look at our Facebook Page
Please click here to visit our website for more information about LittleStreams
Subjects:
Grades:
5th - 8th, Adult Education
Types:
CCSS:
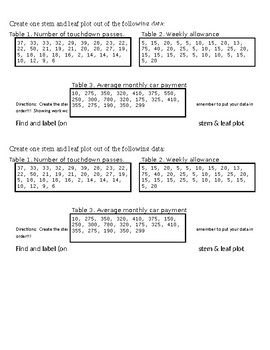
Stem and Leaf Football
Students will create their own stem and leaf plot using the data given. The directions are attached...poster paper, rulers and colored utensils will be needed!!Great for subs, days with a half of your classes or just plain ole' review!
Subjects:
Grades:
6th - 8th
Types:
TI-84 Graphing Calculator & Linear Regression
The simple prompts can be used by teachers to support lesson instruction, and as a resource for students. Display the prompts for students to utilize as a resource when working collaboratively or during direct instruction. Provide copies for students to add to their notebooks as a resource. Laminate and display some or all of the prompts to use with other mathematics lessons.
The intent of the prompts is to provide easy reminders as to how to use the TI-84 graphing calculator as a tool when
Subjects:
Grades:
8th - 12th, Higher Education
Types:
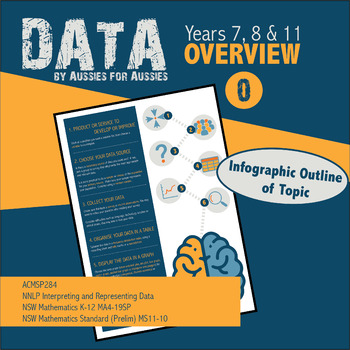
Overview Infographic Data 4-19SP
This infographic has been designed as a roadmap or mindmap of the Stage 4 Mathematics outcome :Collects, represents and interprets single sets of data, using appropriate statistical displays (MA 4-19 SP)It gives an outline of how the resources for this unit of work have been compiled and are developed from one to the other, ensuringthat each dot point of the outcome has been covered. The resources contained in this unit of work also ensure that the relatedaspects in the National Numeracy Progre
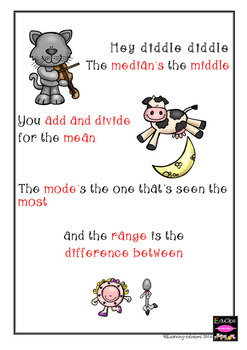
POSTER: Maths Terms - median, mean, mode, range
This is a fun poster based on the old nursery rhyme "Hey Diddle Diddle".
You can put it up in a Maths Centre or paste it into Interactive Maths Books to help students remember and apply the terms.
Subjects:
Grades:
7th - 8th
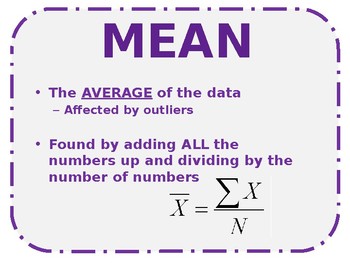
Central Tendency Posters
Posters to print out to put around the classroom to explain measures of central tendency (mean, median, mode, range, standard deviation, IQR)
Subjects:
Grades:
6th - 12th
Types:
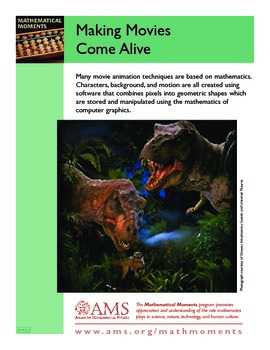
AMERICAN MATHEMATICAL SOCIETY - MATHEMATICAL MOMENTS
This collection of posters/handouts from the American Mathematical Society's Mathematical Moments campaign was downloaded from www.ams.org given to students as a promotional tool of Statistics in cultural context and used as part of course research projects in Introductory or Elementary Statistics class at the college level. Ownership of copyright is strictly the possession of the American Mathematical Society. I am posting under fair use copyright for non-commercial classroom use, ONLY.
Subjects:
Grades:
7th - 12th, Higher Education, Adult Education, Staff
Types:
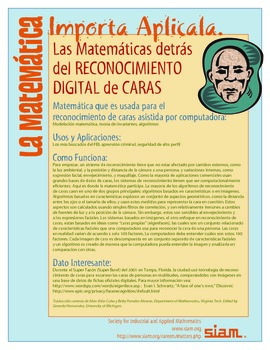
SOCIETY FOR INDUSTRIAL AND APPLIED MATHEMATICS
This collection of posters/handouts from the Society for Industrial and Applied Mathematics Mathematics Matters - Apply It! campaign was downloaded from www.siam.org given to students as a promotional tool of Statistics in cultural context and used as part of course research projects in Introductory or Elementary Statistics class at the college level. Ownership of copyright is strictly the possession of the Society for Industrial and Applied Mathematics. I am posting under fair use copyright f
Subjects:
Grades:
7th - 12th, Higher Education, Adult Education, Staff
Types:
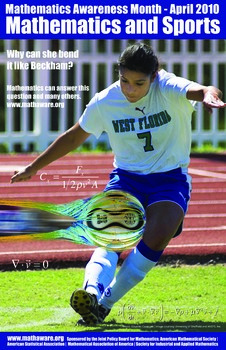
MATHEMATICAL ASSOCIATION OF AMERICA - MATHEMATICS AWARENESS MONTH
This collection of posters/handouts from the Mathematical Association of America Mathematics Awareness Month campaign was downloaded from www.maa.org given to students as a promotional tool of Statistics in cultural context and used as part of course research projects in Introductory or Elementary Statistics class at the college level. The file was recently updated to include the 2015 theme. Ownership of copyright is strictly the possession of the Mathematical Association of America. I am posti
Subjects:
Grades:
7th - 12th, Higher Education, Adult Education, Staff
Types:

Educate v. Incarcerate
This is a nice flow chart that demonstrated the different between education and incarceration.
Subjects:
Grades:
7th - 12th, Higher Education
Types:
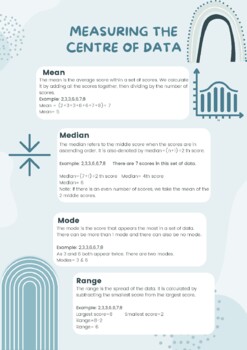
Statistics Classroom Display
Brighten your classroom by adding this centre of data display. This is great for students to refer to while completing work. Please note the spelling used is British English.
Subjects:
Grades:
5th - 9th
Types:
Showing 1-19 of 19 results


