23 results
Adult education Common Core HSS-CP.A.4 resources
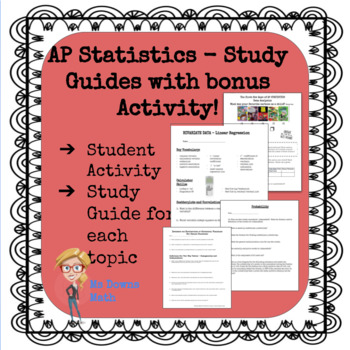
AP Statistics Study Guides - All Topics!
There is a pdf file study guide for each topic in the AP Statistics curriculum. Exploring Data, Normal Distributions, Linear Regressions, Experiments and Designing Studies, Probability, Random Variables, Sampling Distributions, Confidence Intervals, Hypothesis Tests, Comparing Populations, Chi Square Procedures, and Inference about Regression. I have students complete one for each unit. At the end of the year, they have a great study packet for the AP Exam! Student feedback has indicated that th
Subjects:
Grades:
9th - 12th, Higher Education, Adult Education
Types:
CCSS:
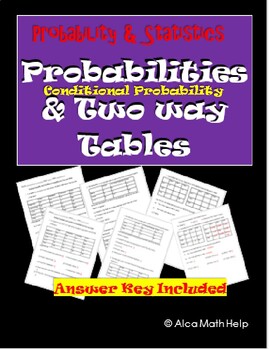
Conditional Probability and Two-Way Worksheet, CW, HW, Review CP Stats, Ap Stats
If you are looking for an easy to follow for students. You are at the right place. This is a quick and easy to follow activity sheet that brings across the concept clear and precise. Teachers in my department love this activity sheet. This is useful of CP Probability and Statistics, AP Statistics and Algebra 1 statistics unit.Probability and Conditional Probability ObjectivesAt the end of the lesson students should be able to:1. Interpret two-way tables2. Create relative frequency tables for wh
Subjects:
Grades:
9th - 12th, Higher Education, Adult Education, Staff
CCSS:
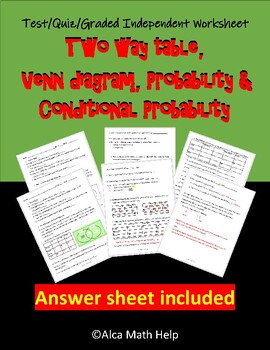
Unit Test/Quiz/Packet- Two-way table, Venn diagram, Conditional Probability
If you are looking for an easy to follow for students. You are at the right place. This is a quick and easy to follow activity sheet that brings across the concept clearly and precisely. Teachers in my department love this activity sheet. This is useful for CP Probability and Statistics, AP Statistics and Algebra 1 statistics unit.5W’s and How of statisticsAt the end of the lesson students should be able to:1. Recall the history of statistics2. Define the 5W’s and How of statistics with example
Subjects:
Grades:
9th - 12th, Higher Education, Adult Education, Staff
CCSS:
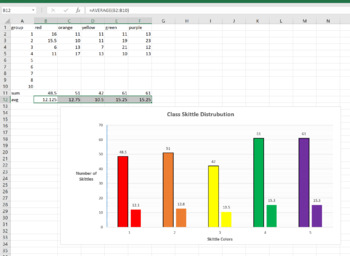
Skittle Statistics MS Excel Mini-Lab
This is a 1 class MS Excel lab for a computer or math class. You can have the students explore the distribution of different color Skittles in class. This is a great mini-lab or half-day activity when you school ends up with a weird schedule day. Tell them they can't eat till the Skittles till the end of class, or they will distort their numbers. Also make sure they don't throw them or shove them up their nose (Yes, stuck Skittles are hard to extract, ask me how I know..)The goal of this lab is
Grades:
6th - 12th, Higher Education, Adult Education
Types:
NGSS:
MS-ETS1-2
, HS-ETS1-2
, HS-ETS1-3
, MS-ETS1-4
, MS-ETS1-1
...
Also included in: Hands-on Science Semester Labs Bundle
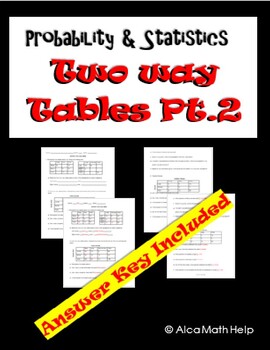
Probability & Statistics- Two-Way Table Worksheet, Homework, Quiz, AP Review
If you are looking for an easy to follow for students. You are at the right place. This is a quick and easy to follow activity sheet that brings across the concept clearly and precisely. Teachers in my department love this activity sheet and the students enjoy it. This is useful for CP Probability and Statistics, AP Statistics and Algebra 1 Statistics unitAt the end of the lesson students should be able to:1. Define two-way tables with its properties.2. Create two- way tables using frequency co
Subjects:
Grades:
9th - 12th, Higher Education, Adult Education, Staff
CCSS:
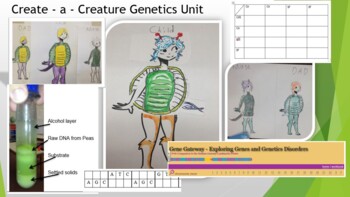
Create - a - Creature Genetics Unit
This whole unit covers the basics of genetics! It includes the Create a Creature lab, home genetic test, Punnet Squares, webquest, and final test!You can also extract DNA from dried peas; practice reading DNA and RNA; explore genetic disorders through the Human Genome Project webquest; and explore pedigree charts! You will have to create your own shell and tail pieces this. The original artist has gone on to draw a Google doodle ! You can also have the students design their own shell / tails. Th
Subjects:
Grades:
7th - 12th, Higher Education, Adult Education
Types:
NGSS:
HS-LS3-3
, HS-LS3-1
, MS-LS4-3
, MS-LS4-1
, HS-LS4-2
...
Also included in: Hands-on Science Semester Labs Bundle
AP Statistics Lessons
This set of PowerPoint presentations includes all the lessons and homework assignments I developed to teach AP Statistics. Each lesson includes lesson goals, lecture materials, bolded key definitions, activities (including links to actual, relevant AP problems by section), and homework assignments.
You could use these lessons to teach in its entirety a year-long AP Statistics course, or a college-level Statistics 101 or even a HS-level non-AP statistics course with minor tweaking. I generally d
Subjects:
Grades:
9th - 12th, Higher Education, Adult Education
CCSS:
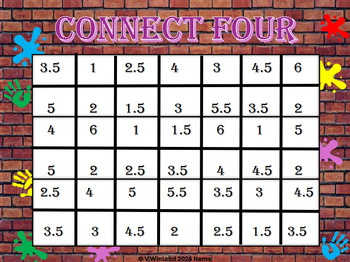
Connect Four ( Statistics)
Statistics Connect FourConnect four by rolling dice and finding averages.Students have to keep track of frequency and relative frequency.Also create a histogram and decide if frequencies create a uniform, normal curve or skewed curve.
Subjects:
Grades:
10th - 12th, Higher Education, Adult Education
Types:
CCSS:
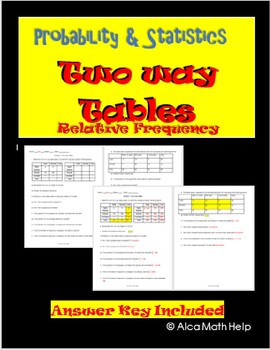
Two-Way Tables Worksheet, Homework, CW, Review, Quiz for CP Stats, AP Stats
If you are looking for an easy to follow for students. You are at the right place. This is a quick and easy to follow activity sheet that brings across the concept clear and precise. Teachers in my department love this activity sheet. This is useful of CP Probability and Statistics, AP Statistics and Algebra 1 statistics unit. Frequency Tables ObjectivesAt the end of the lesson students should be able to:1. Define two-way tables with its properties.2. Create two-way tables using frequency count
Subjects:
Grades:
10th - 12th, Higher Education, Adult Education, Staff
CCSS:

6 Editable Bar Graph Templates 2.0
Finally a simple and professional graph space that students can fill out without any design issues getting in the way. This file contains 6 ready-to-use graph options. Print them and have students fill them with pencil and ruler, or distribute them over computer and let them practice entering the data. Get a project perfect finish every time. Maybe you just want to fill it out live on a projector? The possibilities are endless! It's okay to say you love these bar graphs. So do we.Contains:- 2 bl
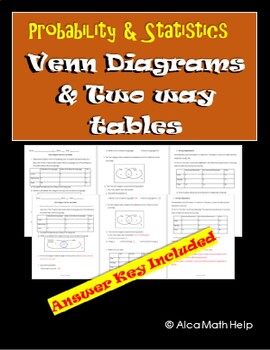
Venn Diagrams and Two-way table Worksheet CP Probs, Homework
If you are looking for an easy to follow for students. You are at the right place. This is a quick and easy to follow activity sheet that brings across the concept clearly and precisely. Teachers in my department love this activity sheet. This is useful for CP Probability and Statistics, AP Statistics and Algebra 1 statistics unit-Venn diagram ObjectivesAt the end of the lesson students should be able to:1. Identify a Venn diagram and its properties2. Shade specific regions of the Venn diagram(
Subjects:
Grades:
8th - 12th, Higher Education, Adult Education, Staff
CCSS:
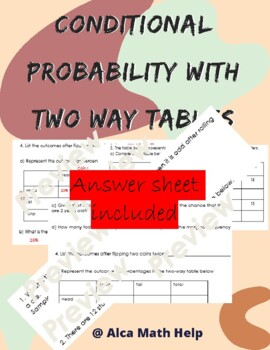
Conditional Probability and Two-way tables AP Stats/ CP Probability and Stats
This activity is design as a practice sheet: classwork or homework or mini quiz. It aims to extend students understanding of probability by teaching the students about conditional probability with two-way tables. Students can work collaboratively or independently.This can also be utilized by students doing AP STAT as bell work pop quiz or any assessment you decide.Feel free to follow me at https://www.teacherspayteachers.com/Sellers-Im-Following/Add/Alca-Math-Help so you can know when the free p
Subjects:
Grades:
10th - 12th, Higher Education, Adult Education, Staff
CCSS:
Algebra 1 - Common Core Practice Final Exam - Google Form #1 (45 Questions)
Hello! The purchase of this product grants the purchase of one (1) DIGITAL (Google Forms) self-grading assessments, which is a practice final exam that has a mix of forty-five (45) multiple-choice & fill-in-the-blank questions on Algebra 1 - 1st Semester Common Core Curriculum.Goals Of This Assessment: Students will be able to:Simplify or identify equivalent algebraic expressions. Represent math relationships using symbolic algebra. Differentiate between linear and nonlinear functions. Model
Subjects:
Grades:
6th - 12th, Higher Education, Adult Education
Types:
CCSS:
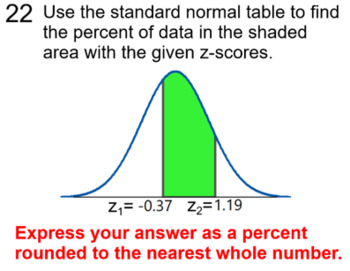
Statistics Unit 2, Notes + 10 Assignments & 6 Intro's for SMART Notebook
Stats Unit 1 for SMART NotebookAll Assignments and Tests can be printed or completed at socrative .comTopics Covered in this UnitPermutationsCombinationsIndependent EventsDependent EventsMutually Exclusive EventsComplementary Events"And" Probability"Or" ProbabilityProbability of "At Least 1"2 way Frequency Tables"Given" Probabilityz-scoreNormal DistributionSample Standard DeviationSample Standard DeviationSample MeanPopulation MeanSample VariancePopulation VarianceStandard Normal TableAssignment
Subjects:
Grades:
10th - 12th, Adult Education
Types:
CCSS:
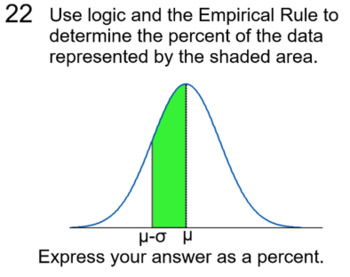
Statistics Unit 2, Notes + 10 Assignments & 6 Intro's for PDF
Stats Unit 1All Assignments and Tests can be printed or completed at socrative .comTopics Covered in this UnitPermutationsCombinationsIndependent EventsDependent EventsMutually Exclusive EventsComplementary Events"And" Probability"Or" ProbabilityProbability of "At Least 1"2 way Frequency Tables"Given" Probabilityz-scoreNormal DistributionSample Standard DeviationSample Standard DeviationSample MeanPopulation MeanSample VariancePopulation VarianceStandard Normal TableAssignment A is a 24 question
Subjects:
Grades:
10th - 12th, Adult Education
Types:
CCSS:
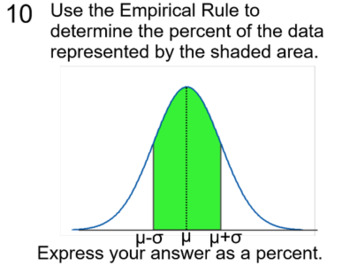
Statistics Unit 2, Notes + 10 Assignments & 6 Intro's for Power Point
Stats Unit 1 for Power PointAll Assignments and Tests can be printed or completed at socrative .comTopics Covered in this UnitPermutationsCombinationsIndependent EventsDependent EventsMutually Exclusive EventsComplementary Events"And" Probability"Or" ProbabilityProbability of "At Least 1"2 way Frequency Tables"Given" Probabilityz-scoreNormal DistributionSample Standard DeviationSample Standard DeviationSample MeanPopulation MeanSample VariancePopulation VarianceStandard Normal TableAssignment A
Subjects:
Grades:
10th - 12th, Adult Education
Types:
CCSS:
The Greek Alphabet: Activity on Categorical Data Representations
Targeted Skills:1. Identify the question2. Recognize data in varying formats3. Construct numerical and graphical displays for categorical data4. Identify distributions or relative values in distributions Targeted Topics:1. Categorical Variables2. Utilizing Variables and Tables for Categorical Data3. Utilizing Graphs for Categorical Data What is Included in this Document?1. Handout Comprising of Activity2. SAMPLE Solutions3. Directions, Skills and Topics
Subjects:
Grades:
7th - 12th, Higher Education, Adult Education
Types:
CCSS:
Passion-Driven Statistics E-book (Introductory/AP Statistics Course Textbook)
Passion-Driven Statistics is an NSF-funded, multidisciplinary, project-based curriculum that supports students in conducting data-driven research, asking original questions, and communicating methods and results using the language of statistics. The curriculum supports students to work with existing data covering psychology, health, earth science, government, business, education, biology, ecology and more. From existing data, students are able to pose questions of personal interest and then use
Subjects:
Grades:
6th - 12th, Higher Education, Adult Education
Types:
SPSS software Secondary Data Analysis Workshop (Introductory/AP Statistics)
This handout is intended for those interested in teaching/learning basic introductory statistics concepts to analyze real data. Students will learn how to tell a story using secondary data analysis. The handout is for SPSS and the US Longitudinal Study of Adolescent Health data set. For handouts on the data set code book and raw data file, a PowerPoint to accompany the handout, or questions please email kristin.flaming@gmail.com or ldierker@wesleyan.edu.This handout was developed as a condensed
Subjects:
Grades:
6th - 12th, Higher Education, Adult Education
Types:
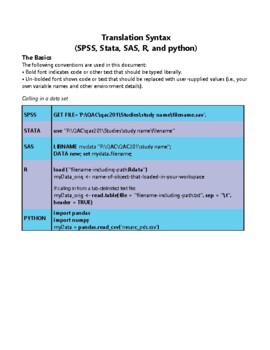
Translation Code
As part of our NSF-funded passion-driven statistics project, we have just started to share more widely our “translation code” aimed at supporting folks in learning code-based software and in moving more easily between them. The pdf includes all of the basic syntax for managing, displaying and analyzing data, translated across SAS, R, Python, Stata and SPSS. http://bit.ly/PDSTranslationCode.For more information about our warm and welcoming data-driven curriculum, check out https://passiondrivenst
Grades:
6th - 12th, Higher Education, Adult Education
Types:
STATA software Secondary Data Analysis
This handout is intended for those interested in teaching/learning basic introductory statistics concepts to analyze real data. Students will learn how to tell a story using secondary data analysis. The handout is for STATA software and the US Longitudinal Study of Adolescent Health data set. For handouts on setting up an account, the data set code book and raw data file, a PowerPoint to accompany the handout, or questions please email kristin.flaming@gmail.com or ldierker@wesleyan.edu.This
Grades:
6th - 12th, Higher Education, Adult Education
Types:
SAS software Secondary Data Analysis Workshop (Introductory/AP Statistics)
This handout is intended for those interested in teaching/learning basic introductory statistics concepts to analyze real data. Students will learn how to tell a story using secondary data analysis. The handout is for SAS (email for R, SPSS, Stata, & Python), a free cloud based system and the US Longitudinal Study of Adolescent Health data set. For handouts on setting up a free SAS account, the data set code book and raw data file, a PowerPoint to accompany the handout, or questions please e
Grades:
6th - 12th, Higher Education, Adult Education
Types:
R software Secondary Data Analysis Workshop (Introductory/AP Statistics)
This handout is intended for those interested in teaching/learning basic introductory statistics concepts to analyze real data. Students will learn how to tell a story using secondary data analysis. The handout is for R or R Studio, a free cloud based system and the US Longitudinal Study of Adolescent Health data set. For handouts on setting up a free R account, the data set code book and raw data file, a PowerPoint to accompany the handout, or questions please email kristin.flaming@gmail.com or
Subjects:
Grades:
6th - 12th, Higher Education, Adult Education
Types:
Showing 1-23 of 23 results

