49 results
Adult education Common Core 6.SP.A.3 resources
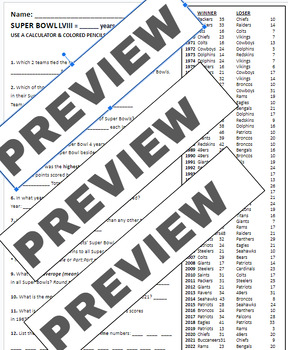
Super Bowl 2023 Math (Fractions, Ratios, Statistics, Box and Whisker Plot, etc.)
5 pages are printables for students. 5 pages are visuals, answer keys, and suggested videos and extensions.Students use a table of all the Super Bowls' winning and losing scores from 1967-2023 to answer questions on MEAN, MEDIAN, MODE, GCF/LCM, RATIOS, FRACTIONS, & a separate page on BOX AND WHISKER PLOTS. There is an interesting activity page on the average amount spent on Super Bowl commercials from 2002 - 2023. On this page, students practice their understanding of mean, median, mode,
Subjects:
Grades:
4th - 9th, Adult Education, Staff
Types:
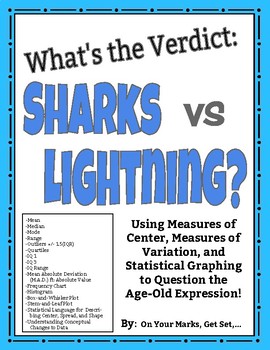
What's the Verdict: Sharks vs. Lightning? Modes of Center, Spread, and More!
Put it to the test! Use the age-old expression: "You are more likely to get struck by lightning than to be bitten by a shark!" to learn and practice Measures of Center, Measures of Spread, Measures of Shape, and Statistical Graphing including:MEANMEDIANMODERANGEOUTLIERS [Using IQR +/- 1.5(IQR)]QUARTILES [lower quartile (IQ-1) and upper quartile (IQ-3)]INTERQUARTILE RANGE (IQR)MEAN ABSOLUTE DEVIATION/ M.A.D. ft. ABSOLUTE VALUESYMMETRY/ASYMMETRY OF DISTRIBUTIONCLUSTERS AND GAPSBELL SHAPED CURVE AN
Subjects:
Grades:
5th - 12th, Higher Education, Adult Education
Types:
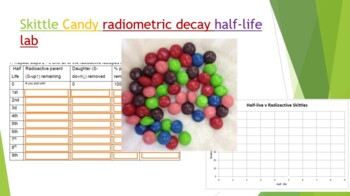
Skittle Radiometric Decay Half-life Lab
Did you know you can use Skittles candy to demonstrate absolute dating and radiometric decay! Buy a 1-4 lb bag at your local bulk warehouse store for savings. This lab is a great way to show how isotopes decay by shaking a plate full of random skittles. Students use Skittles to observe "Isotopes" decay over each half life. At the end of the lab (and only IF they have done all their work) they can enjoy their "daughter products". Skittles were used because they are durable, hypoallergenic, and th
Subjects:
Grades:
8th - 12th, Higher Education, Adult Education
Types:
NGSS:
HS-PS1-8
, HS-PS1-1
, HS-PS1-4
, HS-PS1-6
, MS-PS1-4
...
Also included in: Hands-on Science Semester Labs Bundle
6th Grade Statistics & Data 5 - Box and Whisker Plot Powerpoint Lesson
Sixth Grade Statistics 5 - Box and Whisker Plot Powerpoint Lesson is powerful when used as direct instruction in the classroom, online or individually. It teaches students all the skills necessary to make a box and whisker plot: mean, median, lower quartile Q1, upper quartile Q3, inter quartile range, range, minimum and maximum numbers. Students then are shown how to take this information and build a box and whisker plot. Finally, students are taught how to analyze the box and whisker plot th
Subjects:
Grades:
6th, Adult Education
Also included in: 6th Grade Statistics & Data Bundle - 6 Powerpoint Lessons - 402 Slides
6th Grade Integers 4 - Subtracting Integers Powerpoint Lesson
Sixth Grade Integers 4 - Subtracting Integers - This is perfect for distance learning on Zoom or similar formats. On top of that it is powerful when used as direct instruction in the classroom. It teaches students how to subtract integers using the rules. A review of adding integers is also included. There are 22 effective teaching strategies based on research used in this lesson. For best results, students should have white boards and dry erase markers. For instructions on how to success
Subjects:
Grades:
6th, Adult Education
Also included in: 6th Grade Powerpoint Mega Math Bundle - 58 Lessons - 2923 Slides
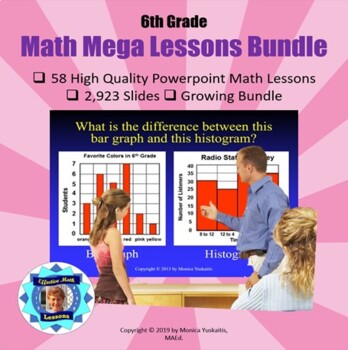
6th Grade Powerpoint Mega Math Bundle - 58 Lessons - 2923 Slides
Sixth Grade Powerpoint Math Bundle is composed of 58 different high quality math powerpoint lessons comprising 2,923 slides. These are perfect for distance learning on Zoom or similar formats. On top of that they are powerful when used as direct instruction in the classroom.There are 22 strategies of effective teaching based on research in these powerpoint lessons. . For further information on each lesson click on them individually. This is a growing bundle which means as new products are a
Subjects:
Grades:
6th, Adult Education
GED Math - Intermediate Problems - 8 Weeks
Your students already know how to work with fractions, decimals, percents, and a calculator. Now get them to the next level. Give them these problem sets to help them pass the GED or HiSET Math tests in 6 to 9 weeks.Use These Problem Sets To:Have students work through up to 9 weeks of problem sets in class, for 3 to 6 hours per week.Teach a variety math topics that are key for college and career readiness, and for passing the GED/HiSET math tests, including: word problems, expressions, equations
Subjects:
Grades:
6th - 12th, Higher Education, Adult Education, Staff
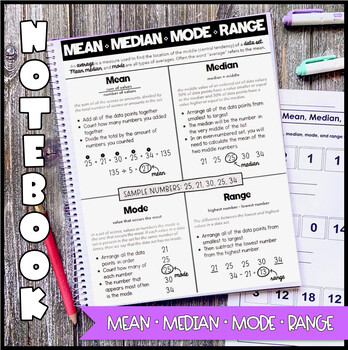
Math Notebook: Mean Median Mode Range (Personal Anchor Chart)
This personal anchor chart will come in handy as you learn to calculate the averages of data sets using different methods. meanmedianmoderange Anchor charts are a helpful addition to 4th-6th grade math notebooks and binders. They can also be displayed in student work areas as a quick reminder of the strategies and steps to solve. Parents will appreciate having an explanation of the grade-level standards for homework help and remote learning as well.Both notebook pages fit: - 8.5 x 11" spiral not
Subjects:
Grades:
4th - 6th, Adult Education
Also included in: Math Notebook: All 5th Grade Personal Anchor Charts! (Growing Bundle)
6th Grade Statistics & Data 6 - Mean Absolute Deviation Powerpoint Lesson
Sixth Grade Statistics 6 - Mean Absolute Deviation Powerpoint Lesson is powerful when used as direct instruction in the classroom, online or individually. It teaches students the steps to take to find the Mean Absolute Deviation of a set of data. The skills necessary to do this task are reviewed: how to find the mean, how to find absolute values of numbers, and how to add and subtract integers. There are 22 effective teaching strategies based on research used in this lesson. For best resul
Subjects:
Grades:
6th, Adult Education
Also included in: 6th Grade Statistics & Data Bundle - 6 Powerpoint Lessons - 402 Slides
6th Grade Integers 3 - Addition of Integers Powerpoint Lesson
Sixth Grade Integers 3 - Addition of Integers - This is perfect for distance learning on Zoom or similar formats. On top of that it is powerful when used as direct instruction in the classroom. It teaches students how to add integers using 3 different methods: using the number line, using pluses, and minuses, and using rules. There are 22 effective teaching strategies based on research used in this lesson. For best results, students should have white boards and dry erase markers. For instr
Subjects:
Grades:
6th, Adult Education
Also included in: 6th Grade Powerpoint Mega Math Bundle - 58 Lessons - 2923 Slides
NYS State Math Test Review Packet: 6th Grade
Aligned with the NYS State Math Test mathematics review sheet. Colorful, kid-friendly way to remind students to baseline at the beginning of the year or to review a full year of 6th grade skills and standards. Includes both straight computation and word problems. Can be used in gifted and talented programs as well or for enrichment for advanced learners or as skill review in HS basic skills or adult education programs in preparation for TASC or GED test.Intervention / MTSS / RTI / AIS / Special
Subjects:
Grades:
3rd - 12th, Higher Education, Adult Education, Staff
Types:
6th Grade Math Video Lesson Full Year BUNDLE *Distance/Flipped/Remote/Online*
6th Grade Math Video Lessons are ready to go and I am excited to offer them to you and your students in this FULL YEAR VIDEO LESSON BUNDLE. Are you considering Flipped Learning this coming year? Will students be learning virtually and you want them to have access to video lessons they can refer to for extra help? Do you plan on having your student’s home-schooled this coming year and you want them to get the same instruction they would if they were attending an in-person classroom? Teachers, do
Subjects:
Grades:
4th - 8th, Higher Education, Adult Education, Staff
Types:
6th Grade Statistics & Data 2 - Mean, Median, Mode & Range Powerpoint Lesson
Sixth Grade Statistics 2 - Mean, Median, Mode and Range Powerpoint Lesson is powerful when used as direct instruction in the classroom, online, or individually. It teaches students how to find the mean, median, mode and range in a group of statistics. There are 22 effective teaching strategies based on research used in this lesson. For best results, students should have white boards and dry erase markers. For instructions on how to successfully use this powerpoint math lesson click here.
Subjects:
Grades:
6th, Adult Education
Also included in: 6th Grade Statistics & Data Bundle - 6 Powerpoint Lessons - 402 Slides
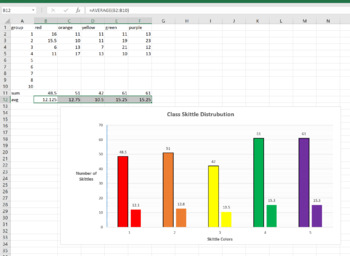
Skittle Statistics MS Excel Mini-Lab
This is a 1 class MS Excel lab for a computer or math class. You can have the students explore the distribution of different color Skittles in class. This is a great mini-lab or half-day activity when you school ends up with a weird schedule day. Tell them they can't eat till the Skittles till the end of class, or they will distort their numbers. Also make sure they don't throw them or shove them up their nose (Yes, stuck Skittles are hard to extract, ask me how I know..)The goal of this lab is
Grades:
6th - 12th, Higher Education, Adult Education
Types:
NGSS:
MS-ETS1-2
, HS-ETS1-2
, HS-ETS1-3
, MS-ETS1-4
, MS-ETS1-1
...
Also included in: Hands-on Science Semester Labs Bundle

Unit 9: Data and Statistics Fillable Notes
Unit 9: Data and Stats(No 9.3/ Skip)9.1 Central Tendencies: Mean, Median and Mode9.2 Graphical Data: Bar Charts, Dot Plots and Histograms9.3 NONE9.4A 5 number summary and box and whisker plots 9.4B Standard Deviation9.5/9.6 Data Distributions (skewness) left or right9.7 Frequency Tables and relative frequency tablesStudents go over the vocabulary and complete the examples with the vocabulary scaffolded. Notes are scaffolded. Includes hook video hyperlinked on the "learning objective" title. Key
Subjects:
Grades:
6th - 12th, Higher Education, Adult Education
Game Templates Bundle
This Bundle includes Templates to create your own games! You can use this for any subject, any grade level! This is a great investment since you can use the templates over and over again!Game Templates included are:Connect 4MonopolyScrabblePac-man Race If you ever need any help with any of the templates and creating your own games with them, please reach out to us! We are happy to help!contact@middlemathenthusiast.com
Subjects:
Grades:
PreK - 12th, Higher Education, Adult Education, Staff
Types:
NGSS:
MS-ESS3-2
, MS-ESS3-1
, MS-ESS3-5
, MS-ESS3-4
, MS-ESS3-3
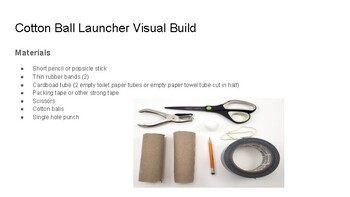
Project Based Learning Cotton Ball Launcher Visual Build Guide
10 Reasons Why You Will Want to Purchase this Hand ON Activity!1. It will keep kids entertained.2. Kids will be engaged with their activity.3. FEWER BEHAVIOR INCIDENTS4. Kids will enjoy their work activities.5. It is just plain fun.6. State Standards Align.7. Kids are actively engaged.8. Sequential Activity9. Bloom's higher-order thinking and process skills center 10. Student-led.
Subjects:
Grades:
1st - 11th, Higher Education, Adult Education, Staff
Types:
6th Grade Math Module 6 Statistic Video Lessons
6th Grade Math Module 6 Video Lessons covering Statistics is ready to go! Are you considering Flipped Learning this coming year? Will students be learning virtually, and you want them to have access to video lessons they can refer to for extra help? Do you plan on having your students home-schooled this coming year and you want them to get the same instruction they would if they were attending an in-person classroom? Teachers, do you sometimes wonder what you will do if and when you need to miss
Subjects:
Grades:
4th - 10th, Adult Education
Types:
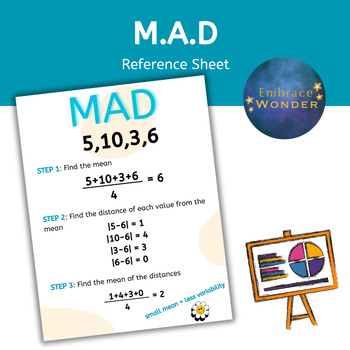
M.A.D Reference Sheet | Mean Absolute Deviation Graphic Organizer | Statistics
Teaching M.A.D? Is your classroom filled with the joy of students analyzing data and crunching numbers? Add this Mean Absolute Deviation Reference Sheet to your lesson collection. Also great for students in an IEP that require a graphic organizer in their lessons. Easy to print and project!What's included:1 PDF• Images are high resolution PDFs, perfect for printing and web use.---------------------------------------------------------------------------------------------------------------Let's Con
Subjects:
Grades:
5th - 12th, Higher Education, Adult Education, Staff
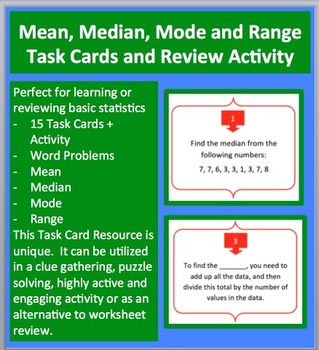
Mean, Median, Mode and Range Task Cards and UNIQUE Activity
This 15 Statistics Task Card resource allows your students to review mean, median, mode and range problems (includes many word problems). Questions include: #3. To find the _______, you need to add up all the data, and then divide this total by the number of values in the data. #6. Jake read 5 books in May, 9 books in June, 7 books in July, and 11 books in August as part of his local libraries reading program. What is the average number of books Jake read per month? Do you like these Task Card
Subjects:
Grades:
5th - 9th, Adult Education
Types:
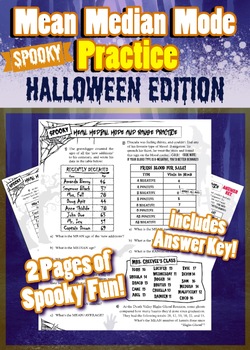
Halloween Mean Median Mode Range Practice - Spooky and Fun Math Handout
Spooky and FUN Mean Median Mode Range Practice - Halloween Printable ActivityEven your most ghoulish students will love this handout! It's full of hilarious scenarios and monster names, and includes lots of spooky fonts and icons. Your students will be so entertained by this printable, that they'll forget they're improving their math skills while using it.Since each problem on the handout is a multi-part problem, this handout features over 25 chances for students to improve their statistical ana
Subjects:
Grades:
4th - 9th, Adult Education
Types:
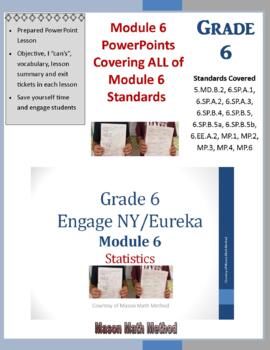
6th Math Module 6 Topics A-D PowerPoint Package on Statistics
This download contains 6th grade math Module 6 Topic A-D Lessons 1-19 PowerPoint Lessons inspired from the Engage NY Eureka Math program, and self-made using other various resources (Total 1,208 slides). Topic A covers the following: Statistical questions, categorical/numerical data, displaying a data distribution, creating a dot plot, and review histograms.Topic B mainly covers the following: MAD (Mean absolute deviation)Topic C covers the following: Mean, Median, Mode, Range, Stem-and-Leaf P
Subjects:
Grades:
4th - 7th, Higher Education, Adult Education, Staff
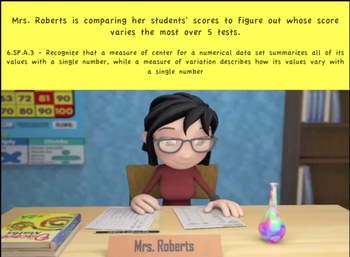
Common Core Math Activity (Math scores)- Statistics (Measure of Variation)
Use engaging animation of Math problem and worksheet to review Common Core Math skills.
Mrs. Roberts is comparing her students' scores to figure out whose score varies the most over 5 tests.
You can use this activity as warm up/bell ringers, review, group activity, and remedial-activity. The voice-over/narration makes it an excellent tool for different learning styles and ESL learners.
Included:
* 3D animation video (less than 2 minutes long) showing the Math problem scenario with text d
Subjects:
Grades:
5th - 7th, Adult Education, Staff
Types:
CCSS:
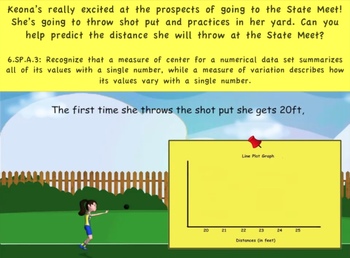
Common Core Math Activity (Shot Put) – Statistics, Median, Mode, Range
Use engaging animation of Math problem and worksheet to review Common Core Math skills. This resource covers 6th grade Common Core standard 6.SP.A.3
Keona’s really excited at the prospects of going to the State Meet! She’s going to throw shot put and practices in her yard. Challenge your students to predict the distance she will throw at the State Meet.
You can use this activity as warm up/bell ringers, review, group activity, and remedial-activity. The voice-over/narration makes it an excel
Subjects:
Grades:
4th - 7th, Adult Education
Types:
CCSS:
Showing 1-24 of 49 results

