13 results
Not grade specific Common Core 6.SP.A.3 resources
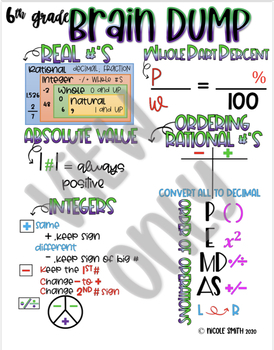
6th Grade Brain Dump
This is a summary of what my 6th graders had to learn by the end of the school year. It's a straight to the point brain dump of information and strategies they can easily use and remember. Suggestions: They would copy this while in stations, during bell-ringer, at home for homework, and even use a tutorial tool for past and current assignments. They didn't write everything at once towards the beginning. It was given as they learned the material, but it's up to you to decide that. (Based off my c
Subjects:
Grades:
6th - 12th, Not Grade Specific
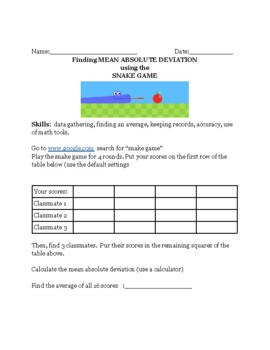
Mean Absolute Deviation using Video Games
This activity uses the Snake game data to calculate the Mean Absolute Deviation of a set of numbers. This activity allows students to use their game data (and their classmates) to make a real connection to the statistic. This activity does not have a answer key because each child will have an answer that they can check on their own.
Subjects:
Grades:
Not Grade Specific
Types:
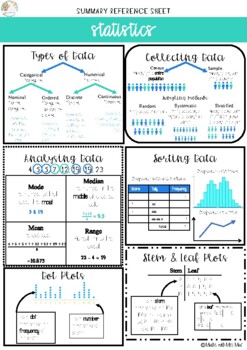
Summary Reference Sheet - Statistics
This product summarises key information when introducing statistics. Print and distribute to students to use as summary reference sheets while they work through the topic or display on your bulletin boards or classroom walls all year round. You and your students will find this simple yet informative cheat sheet easy to use!
Subjects:
Grades:
Not Grade Specific
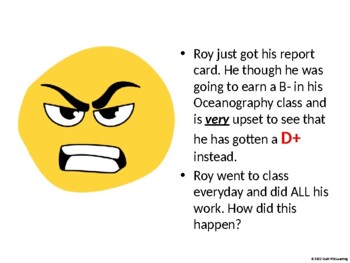
"Why Don't I Have an A???" Weighted Averages & Grade Calculation Activity
What's My Grade?! - Weighted AveragesDo your students constantly ask you "What's my grade" or "If I complete this assignment, what will my grade be"? This is a great presentation that can be used any time during the school year to help your students understand where their grade comes from and what a weighted average is. It is especially useful at the beginning of year to set grade expectations or at the end of the year to help students make sense of their grades. This presentation works with ALL
Grades:
Not Grade Specific
CCSS:
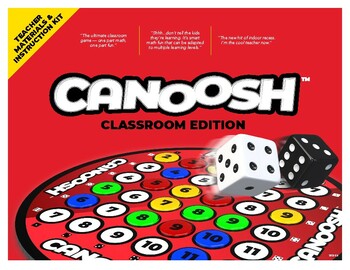
Canoosh Dice Probability Game — Complete (7 Games)
Canoosh is a collection of fast-action, easy-to-learn classroom dice games based on a simple two-dice probability chart. It was designed to be inclusive of any age/learning ability and integrates healthy competitive fun with a range of math learning concepts:Addition and subtractionFractionsProbability and statisticsStrategyCanoosh Classroom Edition is designed to be projected on a wall or chalkboard. You can use it with an entire class, divided into teams, in smaller group play, or as the new f
Subjects:
Grades:
Not Grade Specific
Types:

Making Comics Issue #4: Climate Change
While previous issues used comics to explore comics and writing, Making Comics Issue #4 uses comics to present information related to a specific topic: climate change! This is a great award-winning resource for any science classroom. It can be a solid reading resource around Earth Day to give students something other than a textbook to look at. In addition to climate change, it also presents the fundamentals of modeling and includes historical notes on the development of climate change models ov
Subjects:
Grades:
Not Grade Specific
Types:
CCSS:
Super Bowl INTERACTIVE Bulletin Board
This is a mixture of resources where you can create a prediction of what team you think will win the super bowl. I have used this in the path to create bar graphs of who your class thinks is going to win the super bowl. We have done it at the level where we had multiple team predictions 2 NFC teams 2 AFC teams then we take away those teams at the end. I also have students write out their responses in a sentence or a mini paragraph explaining why they choose the team they choose. Each year I typi
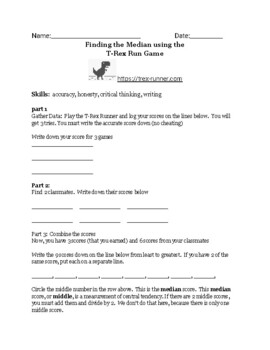
Finding the MEDIAN using video games.
In this activity your students will learn how to find the median of a set of data. They will use a game to gather their data, and then share their data with others. The will also learn a skill that is often overlooked. What happens when low or high scores are added to a set of data. What is the impact on the central tendency.
Subjects:
Grades:
Not Grade Specific
Types:
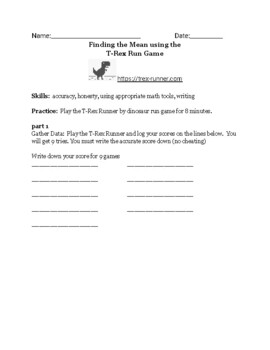
Finding the Mean/Average using Games
This activity is designed to have your students find the average or mean of a set of data. Also, what is the impact to the average by adding more scores to a skill based game. Students should have access to T-Rex Run Game https://trex-runner.comSkills taught are paying attention to accuracy. Students need to be honest when gathering data. They should use using appropriate math tools like a calculator when addition of several numbers will take just too long. Also, students will write using s
Subjects:
Grades:
Not Grade Specific
Types:
Mean, Median, Mode, and Visualizing Real Data - Group Activities
These activities and handouts task groups of students to calculate the mean, median, mode, and range of real data, as well as plotting a box plot and a histogram, through 6 group activities that can take 1 to 3 hours, depending on the class. Solutions are provided where applicable (3 activities).Target Level of Math Class:Pre-algebra, arithmetic, introduction to statistics, data visualizationAccess to calculators.For completion in groups in person, with students actively sharing solutions with
Subjects:
Grades:
Not Grade Specific
Types:
Canoosh Dice Probability Game (1-Game Sampler)
Canoosh is a collection of fast-action, easy-to-learn classroom dice games based on a simple two-dice probability chart. It was designed to be inclusive of any age/learning ability and integrates healthy competitive fun with a range of math learning concepts:Addition and subtractionFractionsProbability and statisticsStrategyCanoosh Classroom Edition is designed to be projected on a wall or chalkboard. You can use it with an entire class, divided into teams, in smaller group play, or as the new f
Subjects:
Grades:
Not Grade Specific
Types:
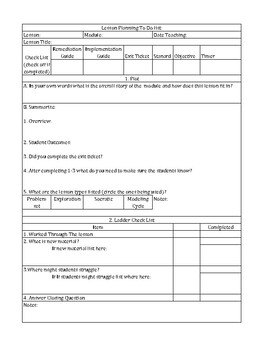
Eureka Math/Engage NY Lesson Plan Set Up and Reflection
Breaking down the lessons for Eureka Math or Engage NY can become daunting. With this CCSS aligned curriculum it is important that we stick to the lesson give with fidelity. However, this is not always easy to communicate on a lesson plan. I have take Eureka Materials and developed a lesson plan outline to help you create and implement your Eureka Math/Engage NY lesson plan.
Grades:
Not Grade Specific
Social Media Math: Word Problems and Solutions, applying algebra and more
Use these 11 math word problems to reinforce essential problem-solving and communication skills, all couched in the context of social media and the internet. To solve these problems, knowledge of English language, arithmetic, fractions, decimals, percents, algebra, calculator use, logarithms and exponents, statistics, graphing, and other skills may be required. Solutions are given with explanations, including how to write and solve relevant equations, along with additional discussion questions
Subjects:
Grades:
Not Grade Specific
Types:
Showing 1-13 of 13 results

