50 results
10th grade graphing simulations
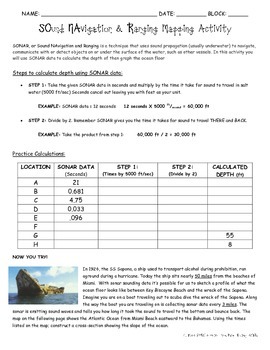
SONAR Calculations and Graphing
In this classroom activity, students are guided through the calculations necessary to obtain ocean depth from SONAR data. Then they use data to complete a profile of the part of ocean floor from which the data came. Please note: this does not show all the parts of the ocean floor. Image and activity where adapted from Naval History STEM H.
Subjects:
Grades:
6th - 12th
Types:
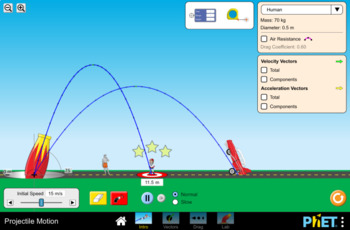
Projectile Motion Simulation Lab- PhET
This handout is meant to accompany the Projectile Motion simulation found here: https://phet.colorado.edu/en/simulation/projectile-motion
45 minute lesson time
This lab can be used to teach a range of concepts such as:
-Relationships between independent/manipulated and dependent/responding variables
-Forces in motion
-Projectile Motion
-The relationship between firing angle and distance traveled
-Graphing independent/ dependent variables
-Creating data tables
Subjects:
Grades:
6th - 12th, Higher Education, Adult Education
Types:
INVESTING IN THE STOCK MARKET : an in-class simulation guide
This is a 29 page package to support teachers in running a 24 day stock market simulation in their grade 5-10 classroom. I have used a version of this in my class for several years now and the kids LOVE it! I have adjusted it and perfected it to include a 24 page student booklet, an evaluation sheet, and a three page SPECIFIC teacher instruction manual.
I offer this exact resource IN FRENCH. Check out La classe de Mme Geneviève for other Math Resources and French Immersion Resources.
Thank
Subjects:
Grades:
5th - 10th
Types:
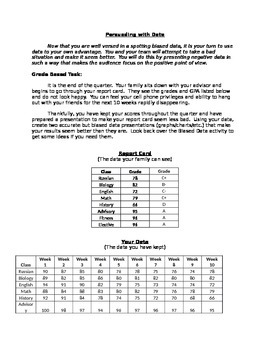
Persuading with Data: Using data bias to your advantage
The activity is designed as a follow-up to my Data Bias activity (posted for free). Student use what they learned about data bias to create data presentations (graphs, charts) that help prove their point. Multiple scenarios are given where students are trying to convince their parents that their grades/behavior aren't bad.
This activity helps students internalize the power of data bias and makes them more likely to look out for this bias in the real world. This makes for a really fun homew
Subjects:
Grades:
7th - 10th
Types:
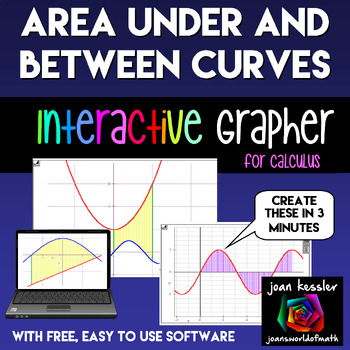
Calculus Area Under Curves Interactive Graphing Tool
Your Calculus students will love these interactive simulations and demonstrations of the Area Between Curves and the Area Under a Curve! These Dynamic moving 3-d graphs will help them visualize the concepts you teach. Engaging and so easy to use, you will be demonstrating important concepts in AP Calculus AB, BC, Honors or traditional Calculus 1 and 2 in minutes. Project from your computer onto a screen or whiteboard.Wow your Calculus students with interactive math explorations. Explore the a
Grades:
10th - 12th, Higher Education
Types:
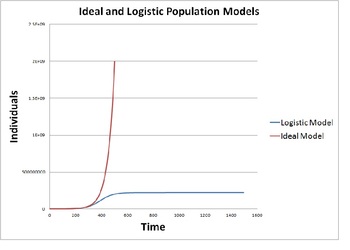
Modeling Population Growth (Ideal vs. Logistic Model)
This activity provides instructions to construct a mathematical model on a blank spreadsheet that simulates population growth using an ideal model and a logistic model. The activity provides background discussion and then gives instructions on how to program a spreadsheet to produce and display the ideal and logistic population models. Their results are studied for various cases including human population, rabbits, polar bears, bacterial and yeast colonies.
This quantitative population model
Subjects:
Grades:
9th - 12th, Staff
Types:
Simulation Classroom Economy Lesson Plan
This lesson plan is for a fifth or possible sixth grade economics unit. The lesson is specially designed to be a part of an economics unit which requires or needs a simulation. The lesson plan includes critical questions, currency template, simulation record sheet and step-by-step instructions on how to set up your classroom. This lesson plan will make your classroom economy simulation meaningful, integrated, value based, challenging and active (MIVCA).
Subjects:
Grades:
4th - 12th, Higher Education
Types:
Teach Students to Make a Survey & Presentation with Google Forms & Slides
Show your students how to create a poll/survey using Google forms. This easy-to-follow slides presentation shows students how to make and customize a survey, make a QR code with a direct link to the survey, and use the results to make a presentation for the class using graphs from their data.
Subjects:
Grades:
5th - 12th
Types:
LA BOURSE : UNE SIMULATION EN CLASSE (Stock Market simulation kit)
This is a 28 page package to support teachers in running a 24 day stock market simulation in their grade 5-10 classroom. I have used a version of this in my class for several years now and the kids LOVE it! I have adjusted it and perfected it to include a 24 page student booklet, an evaluation sheet, and a three page SPECIFIC teacher instruction manual.The entire content is IN FRENCH for the French Immersion--or francophone--classroom. I also offer this exact product IN ENGLISH, if you are int
Subjects:
Grades:
5th - 10th
Types:
GPS Simulation - Applications of Algebra and Geometry - Aligned with Numb3rs
Are you tired of hearing your students say "When would you ever use this!?" This lesson is a perfect way to silence their complaints!
I originally designed this lesson to be used after watching the episode "Convergence"of the CBS television series Numb3rs. I think every middle/HS teacher should own copies of this series. If you aren't familiar with the show, it is basically a crime show where the characters solve crimes with math. (Similar to CSI) You might be able to download free episodes
Grades:
8th - 12th
Types:
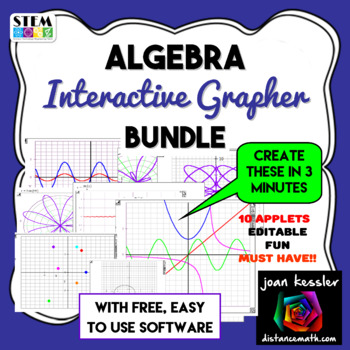
Algebra Interactive Dynamic Easy Fun Graphing App with Editable Templates
Create Cool Graphs easily! No internet needed. No install - even runs from a flash drive. Works anywhere on any PC Computer. Not only can you create interactive dynamic graph for display, you can copy & paste the graphs into a test or handout.Great for Algebra, PreCalculus, and Trigonometry. You will love this!!! This resource is an amazing addition to all of your your Algebra based classes, Algebra 1, Algebra 2, PreCalculus or College Algebra and great for explorations! Create Inter
Subjects:
Grades:
8th - 11th
Types:
Stock Market Simulation Project, Grade 7 Math, PBL Extended Project
Everything you need to run a stock market simulation project with your class. I used this with grade 7 students, but could be used or modified for a range of grades. Students will learn what the stock market is and how it works, make their own informed stock purchases, and then make trades with each other to simulate the stock exchange in your classroom over several class periods. They will be required to record and track their data in multiple ways and reflect on what they learned at the end. I
Grades:
7th - 10th
Types:
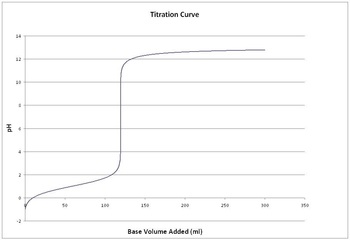
Simulating Titration of Acid on a Spreadsheet
This activity guides students to construct a spreadsheet from a blank Excel workbook that will simulate titration of acids or bases.
*Teacher background on Excel is not required*
After constructing the spreadsheet and graphs the students will experiment with the spreadsheet to answer analysis questions that will help students learn the mathematical nature of titration (solutions are provided including descriptions of all spreadsheet manipulations necessary to solve each problem).
The va
Subjects:
Grades:
10th - 12th, Higher Education
Types:
Environmental Science - Water Budget Modeling
Scope of the Lesson:One of the challenges facing educators of climate change is the spatial and temporal separation of the effects of climate change that is perceived by students. In order to help with these separation issues, students need to understand that climate change does not only impact the poles but can have significant local impacts as well. Accessed through the internet, WebWIMP is a Web-based, Water budget, Interactive Modeling Program that in essence is a simple climate model that c
Subjects:
Grades:
10th - 12th
Types:
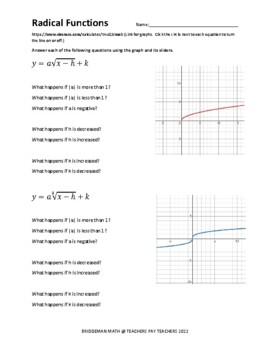
Graphing Radical Functions on Desmos
Introduction to radical functions that allows students to manipulate the parent graphs to see the effects of changing a, h, and k.
Subjects:
Grades:
9th - 12th
Types:
CCSS:
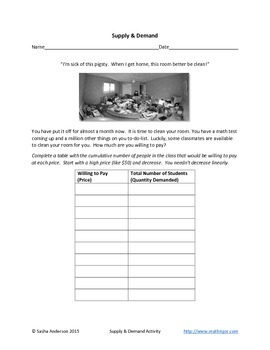
Supply and demand
A classroom activity where student build their own demand and supply curves based on what they are willing to pay (or be paid) for a clean room. Students must reason quantitatively and use units common in economics to solve problems in market equilibrium. Algebra- linear equations, systems of equations, and functions.
Subjects:
Grades:
9th - 12th, Higher Education, Adult Education
Types:
CCSS:
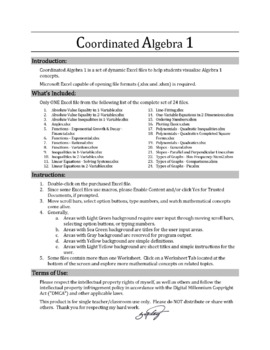
Demonstrate Line Fitting with an Animated Excel File
Simple to use animated Excel file for in class demonstration of Line Fitting using linear regression. Move scroll bars, select option buttons, type numbers, and watch these mathematical concepts come alive. You must use Microsoft Excel that is capable of opening file formats in either .xlsx or .xlsm.
Subjects:
Grades:
9th - 12th
Types:
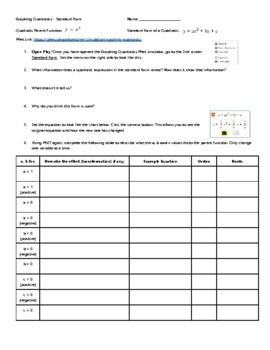
Phet Quadratics Standard Form
Using PhET, students will inquire the components of the standard form equation and graph them. This is an inquiry activity.
Grades:
8th - 12th
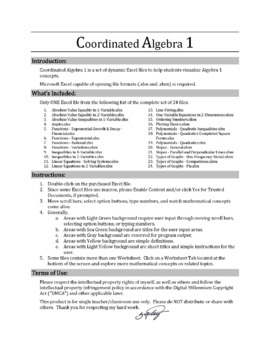
Demonstrate Exponential Functions with an Animated Excel File
Simple to use animated Excel file for in class demonstration of exponential function graphs, specifically, growth, decay, f(x)=ab^x, vertical shift, horizontal shift, and f(x)=ab^(x-h)+k. Move scroll bars, select option buttons, type numbers, and watch these mathematical concepts come alive. You must use Microsoft Excel that is capable of opening file formats in either .xlsx or .xlsm.
Subjects:
Grades:
9th - 12th
Types:
Demonstrate the Slope of Lines with an Animated Excel File
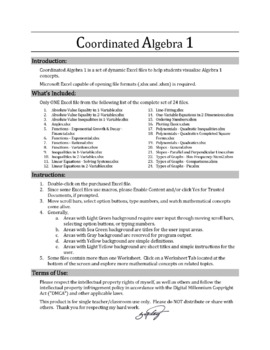
Simple to use animated Excel file for in class demonstration of the graph of lines with positive, negative, integer, fractional slopes. Also includes a worksheet that compares two lines with different slopes you can manipulate. Move scroll bars, select option buttons, type numbers, and watch these mathematical concepts come alive. You must use Microsoft Excel that is capable of opening file formats in either .xlsx or .xlsm.
Grades:
9th - 12th
Types:

Reasons For Seasons
Students will use an online simulation to investigate how the tilt of the Earth causes seasonal patterns at various latitudes.This activity takes my ninth graders about 35 min.
Subjects:
Grades:
8th - 10th
Types:
NGSS:
HS-ESS2-4
Demonstrate Linear Equations in 2 Variable Graphs with an Animated Excel File
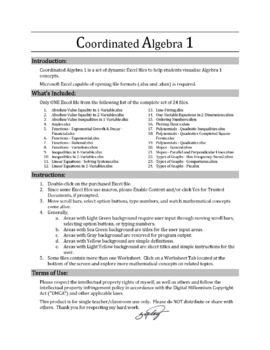
Simple to use animated Excel file for in class demonstration of Linear Equations in 2 Variables. Equation formats include general form, slope-intercept form, point-slope form, and point-point form. Move scroll bars, select option buttons, type numbers, and watch these mathematical concepts come alive. You must use Microsoft Excel that is capable of opening file formats in either .xlsx or .xlsm.
Subjects:
Grades:
8th - 12th
Types:
Demonstrate Quadratics in Completed Square Graphs with an Animated Excel File
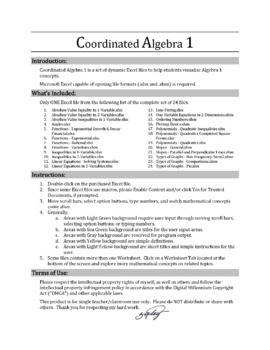
Simple to use animated Excel file for in class demonstration of graphing quadratics in completed form such as y=ax², y-k=ax², y=a(x-h)², and y-k=a(x-h)². Move scroll bars, select option buttons, type numbers, and watch these mathematical concepts come alive. You must use Microsoft Excel that is capable of opening file formats in either .xlsx or .xlsm.
Subjects:
Grades:
9th - 12th
Types:
Wave on a String Virtual PHET Lab
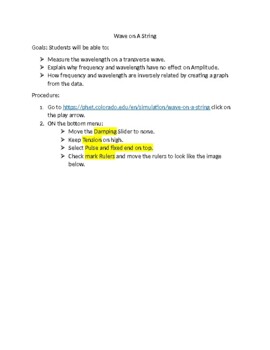
Goals: Students will be able to:Ø Measure the wavelength on a transverse wave.Ø Explain why frequency and wavelength have no effect on Amplitude.Ø How frequency and wavelength are inversely related by creating a graph from the data.
Subjects:
Grades:
7th - 11th, Adult Education
Types:
NGSS:
MS-PS4-1
, HS-PS4-1
Also included in: Physical Science Virtual Lab Bundle
Showing 1-24 of 50 results


