6 results
Psychology research for Microsoft Excel
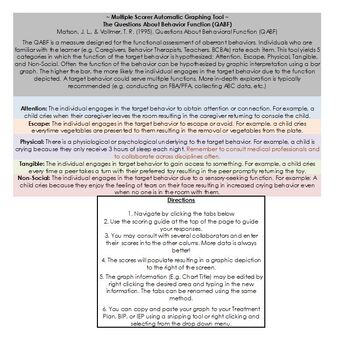
QABF Automatic Graphing Tool (multiple raters)
Editable Automatic Graphing tool for QABF. Multiple Scorers The QABF is a measure designed for the functional assessment of aberrant behaviors. Individuals who are familiar with the learner (e.g. Caregivers, Behavior Therapists, Teachers, BCBAs) rate each item. This tool yields 5 categories in which the function of the target behavior is hypothesized: Attention, Escape, Physical, Tangible, and Non-Social. Often the function of the behavior can be hypothesized by graphic interpretation using a
Grades:
Staff
Types:

Psychology Research - Survey Writing, Data Collection, Correlation Graphing
I teach Dual Enrollment Psychology 101. There's no better way to understand Psychology Research Methods than to conduct your own research. This project requires students to come up with a research question, guided survey questions, collect data, chart and graph that data, recognize correlation, then reflect on their results.While this project is designed to be used in Psychology, I supply you with DOCX files so that you can change the directions to suit ANY SUBJECT! For example, I was require
Grades:
9th - 12th, Higher Education
POSHA–S Data Entry & Graphs for One Group or Sample
Data Entry & Graphs for One POSHA–S Group or Sample The Public Opinion Survey of Human Attributes–Stuttering (POSHA–S) Data Entry & Graphs file is an Excel workbook. It was developed for entering data and automatically analyzing results of the POSHA–S from one sample of people (respondents) who have filled out the POSHA–S. Typically, the POSHA–S is used in projects for a number of people, such as all the teachers in a school, but it can also be used for individual students or clients. Th
Grades:
5th - 12th, Higher Education, Adult Education
Types:
Also included in: POSHA–S Bundle for Use with One Group (or Individual)
POSHA–S Data Entry & Graphs for Two Groups or Samples
Data Entry & Graphs for Two POSHA–S Groups or Samples The Public Opinion Survey of Human Attributes–Stuttering (POSHA–S) Data Entry & Graphs file is an Excel workbook. It was developed for entering data and automatically analyzing results of the POSHA–S from two samples of people (respondents) who have filled out the POSHA–S. Typically, the POSHA–S is used in projects for a number of people, such as all the teachers in a school, but it can also be used for individual students or clients
Grades:
5th - 12th, Higher Education, Adult Education
Types:
Also included in: POSHA–S Bundle for Use with Two Groups (or Individuals)
POSHA–Cl Data Entry & Graphs
Data Entry & Graphs for One POSHA–Cl Group or Sample The Public Opinion Survey of Human Attributes–Cluttering (POSHA–Cl) Data Entry & Graphs file is an Excel workbook. It was developed for entering data and automatically analyzing results of the POSHA–Cl from one sample of people (respondents) who have filled out the POSHA–Cl. Typically, the POSHA–Cl is used in projects for a number of people, such as all the teachers in a school, but it can also be used for individual students or client
Grades:
5th - 12th, Higher Education, Adult Education, Staff
Types:
Also included in: POSHA–Cl (Cluttering) Bundle for Use with One group (or Individual)

A TPT Catalogue for Kenneth St. Louis
St. Louis TPT Catalogue This FREE St. Louis TPT Catalogue should be downloaded first. It provides a topically organized listing of all the materials authored by Dr. Kenneth St. Louis that are published on the www.teacherspayteachers.com website, with links to each item. The IPATHA Series includes all the materials related to measuring public attitudes within the IPATHA (International Project of Attitudes Toward Human Attributes) initiative: the POSHA–S (Public Opinion Survey of Human Attributes–
Grades:
Not Grade Specific
Showing 1-6 of 6 results


