POSHA–S Data Entry & Graphs for One Group or Sample
- XLSX
Also included in
- Bundle for the Public Opinion Survey of Human Attributes–Stuttering (POSHA–S)For use with one group or sample This bundle includes the IPATHA Instrument User’s Guide, the Public Opinion Survey of Human Attributes–Stuttering (POSHA–S) paper-and-pencil instrument for use with one group or sample, thePrice $52.00Original Price $65.00Save $13.00
Description
Data Entry & Graphs for One POSHA–S Group or Sample
The Public Opinion Survey of Human Attributes–Stuttering (POSHA–S) Data Entry & Graphs file is an Excel workbook. It was developed for entering data and automatically analyzing results of the POSHA–S from one sample of people (respondents) who have filled out the POSHA–S. Typically, the POSHA–S is used in projects for a number of people, such as all the teachers in a school, but it can also be used for individual students or clients. This Data Entry & Graphs file, about 1 MB in size, is designed to be used on a computer with relatively large screens, using the Microsoft Excel app. It would likely to be difficult to manage on a smart phone or a tablet with a small screen.
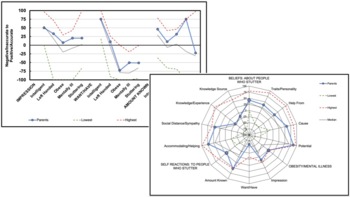
The Excel workbook provides the information needed to enter POSHA–S ratings from any number of respondents in a sample. Columns are provided for 150 respondents, but more can be added as necessary or just one or a few columns can be used. Tabs at the bottom of the workbook are sheets for the following: a Description of the workbook, Instructions and a sample respondent, Data Entry, Data for Graphs, Summary Table, Percentiles, and eight graphs (General, Beliefs, Self Reactions, POSHA–Summary, Age/Education/Income, Health & Abilities, Priorities, and Demographics). If results are entered carefully according to the instructions, results and graphs are generated automatically. In addition to summary POSHA–S scores and graphs, the workbook compares your sample ratings to those from more than 300 different samples (representing more than 40 countries and 25 different languages) in terms of highest, lowest, and median ratings as well as percentiles.


