19 results
High school graphing research pdfs
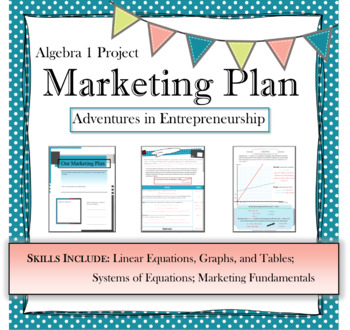
Algebra Marketing Plan PBL | project based learning | real world Math
This Project Based Learning activity will help Algebra 1 students practice setting up and solving systems of linear equations within a real world context. As they take on the role of an entrepreneur, they will write equations, plot coordinate points, graph equations, analyze data, and draw conclusions. This can be used as a group project or individual project and would work great for an end of unit review. ------------------------------------------------------------------------------------------
Subjects:
Grades:
7th - 12th
CCSS:
Also included in: Math Algebra 1 BUNDLE projects, activities, notes, and more
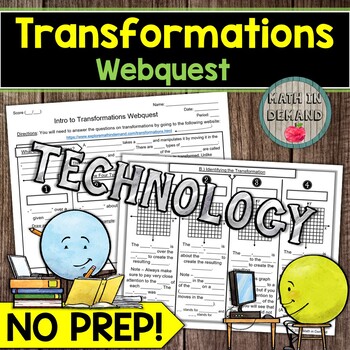
Transformations Webquest Reflection Rotation Translation Dilation
Students will need a device for my math webquest on transformations. Students will be given a link that goes to my website containing information about reflections, rotations, translations, and dilations. Students will learn how to: (1) identify a transformation, (2) perform a transformation, and (3) use the transformation rules to give the coordinates of an image. I have included a worksheet that aligns to the information on my website. All you need to do is print and go! In addition, there is
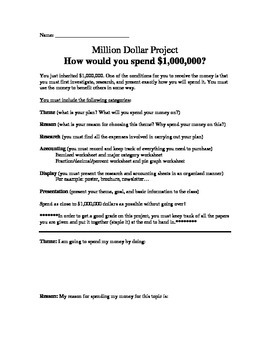
Million Dollar Project (Graphing, decimals, fractions, accounting and percents)
What would you do with a million dollars? How would you spend it?
In this project you've been left a 1 million dollar inheritance. The catch is you must first research and present how you will spend the money.
In the first part of the experiment, the students will fill out an accounting chart, where they will fill out an itemized chart displaying each item they plan on purchasing to complete their million dollar project. They will than be asked to put all those items into major categorie
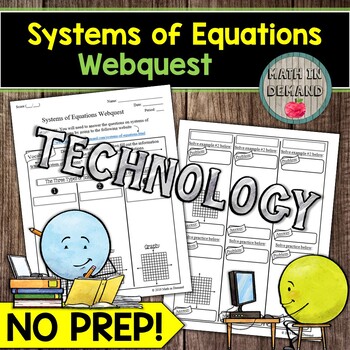
Systems of Equations Webquest Math
Students will need a device for my math webquest on systems of equations. Students will be given a link that goes to my website containing information about the number of solutions (no solution, one solution, and infinitely many solutions), and how to determine the number of solutions by using graphing, substitution, and elimination. I have included a worksheet that aligns to the information on my website. All you need to do is print and go! In addition, there is a 10 problem quiz on my website.

Hurricane Project
This is a great project for students to understand hurricanes to the full extent. We would study hurricanes over a few weeks showing students videos, data, going to the National Hurricane Center website, giving them the opportunity to learn how to plot coordinates and track them. They will understand the damage that can be done and who is called in after a hurricane has hit and the help the city will receive. They will create a hurricane from start to finish, choosing a name based on the month o

Classroom Stockmarket Challenge Project
This project is a real-life example of using percent of change and graphing. The beauty of this project is that it can be done with computers if available or just paper and pencil. It can be used to teach percent of change, graphing, interpretation of data, finance and business. The project can be used as a blank day (at end of unit) or end of year project. I have used it with 7th grade Advanced Math and 8th graders in Pre-Algebra.Other Projects you may be interested in:Circle Graphs using a Spo
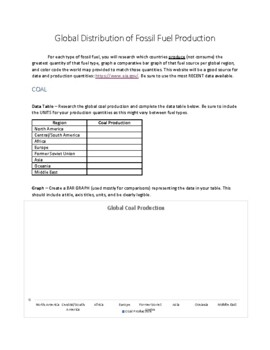
Global Distribution of Fossil Fuels - AP Environmental Science
This worksheet has students researching, graphing, and drawing conclusions about the global distribution of fossil fuel production. For each type of fossil fuel, students will research which countries produce (not consume) the greatest quantity of that fuel type, graph a comparative bar graph of that fuel source per global region, and color code the world map provided to match those quantities.
Subjects:
Grades:
11th - 12th
Types:
Hurricane - Task Cards
This set of nine task cards engages students and requires higher-level thinking. Tasks include: writing mock interviews, researching weather related careers, making comparisons between Hurricane Sandy and other known hurricanes, writing poetry, making tables and graphs. The activities are designed for groups/partners to work together to investigate, create, and present information about hurricanes.
If you would like to "Follow Me," you will receive notifications on the TpT homepage when I h
Subjects:
Grades:
4th - 10th
Types:
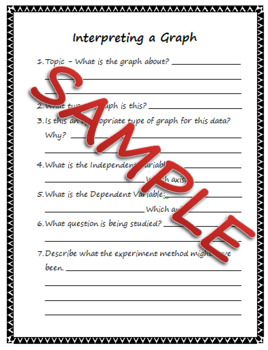
Interpreting a Graph Worksheet
I used this 2-page worksheet with my high school students to interpret graphs and visual data. It goes through all parts of the graph, and asks students to interpret data and trends in the data. Students are asked to describe the scientific method might have been gathered. Students are then asked about implications of the data and how the data might have been used.You will receive a 2-page PDF. If you have any questions - I'd prefer you ask me BEFORE purchasing rather than leaving less than fl
Subjects:
Grades:
7th - 12th
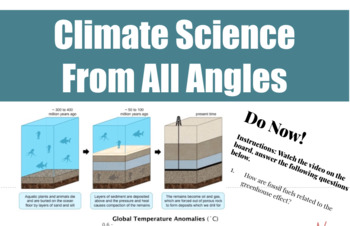
Climate Science From All Angles
Great for remote instruction! Bring your Earth science students' active knowledge of climate to a whole new level with multi-modal activities in "Climate Science from All Angles." These sequenced approaches to building scientific-literacy incorporate current news, graphing, argumentation, and scaffolded methods for writing scientific explanations. Where Science and Literacy Meet! learnmore@stemjourneys.org.
Subjects:
Grades:
5th - 12th, Higher Education, Adult Education, Staff, Not Grade Specific
Types:
CCSS:
NGSS:
MS-ESS3-2
, MS-ESS3-5
, MS-ESS3-3
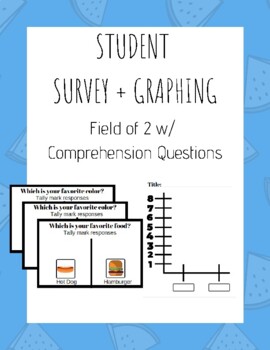
Classroom Social Survey + Graphing (Field of 2 w/ Comprehension Questions)
This set contains materials for your students to socialize and get to know their peers while learning mathematics skills (counting & graphing). This set includes:-IEP Goal Connection-30 prompted survey questions-Blank survey questions-Comprehension Questions-Blank bar graph template Information & Implementation:This set can be used to practice students social skills as well as mathematics skills. -Social: Students are going around the class discussing with peers about their likes & d
Subjects:
Grades:
1st - 9th
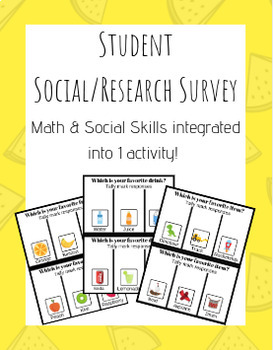
Classroom Social Survey + Graphing
This set contains materials for your students to socialize and get to know their peers while learning mathematics skills (counting & graphing). This set includes:-IEP Goal Connection-30 prompted survey questions-Blank survey questions-Blank bar graph template Information & Implementation:This set can be used to practice students social skills as well as mathematics skills. -Social: Students are going around the class discussing with peers about their likes & dislikes. -Math: Students
Subjects:
Grades:
1st - 9th
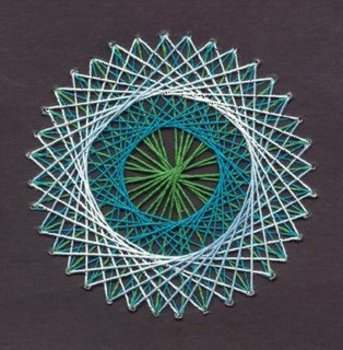
IB-Extended Essay Suggestion: The Mathematics of String Art
This document provides ideas for an extended essay investigation into the maths of string art. Ideal for International Baccalaureate Extended Essays
U.S. States and their Demographics (based on 2010 U.S. Census)
This 50 page resource (PDF) contains census information for each of our fifty (50) states. Now, your students can use official 2010 U.S. Census population numbers (U.S. Census Bureau) for their research, analysis, and/or project creation.
Included in this resource are the following:
State Demographics (state population totals of each of our fifty (50) states by sex, by age groups, by ethnicity, and by race)
This resource can be used for the following:
drawing evidence from literary or informa
Grades:
3rd - 12th
Types:

Deadly Volcanos!
This worksheet can be used in both math and science and possibly social studies. It focuses on five particular volcano eruptions, the students need to look up those eruptions and find the death toll and graph them on the worksheet. My students really loved this activity. It is a very fun way to compare the eruptions of some of the most famous volcanos and practice graphing.
Grades:
5th - 9th
Types:
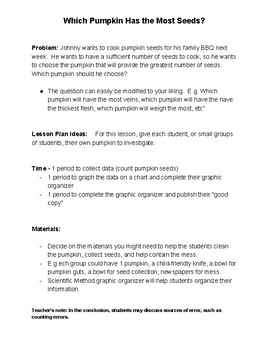
Investigating Pumpkins (Halloween) - Data Management/Science Activity
This is an easy science activity which helps introduce or refine scientific method skills for students.I have used this activity during several Halloween days, fall activities, and when introducing the scientific method.High school teachers can easily adjust the lesson to suit their own expectations.I have included a simple graphic organizer that can be used for any science experiment.Enjoy!
Subjects:
Grades:
1st - 12th
Types:
Data Management - Graphing Analysis Template
Curriculum: Grade 7 Ontario Math
Strand: Data Management
It's important for students to be able to analyze their data and draw conclusions from the surveys they have conducted. In this written assignment, students explore the following:
- Potential Biases
- Which questions provided the most valuable data
- Which questions provided the least valuable data
- Were the questions framed for the correct demographic
- Conclusions made based on the purpose of conducting the survey
...and much more
Grades:
7th - 10th
Types:
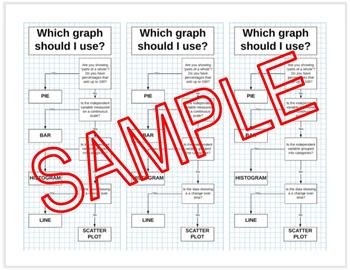
WHICH GRAPH SHOULD I USE? - Graphing - Math - Science - Interactive Notebook
Have trouble teaching students which graph is appropriate? This is the resource for you.
As you can see from the preview the branching tree walks students through 4 simple questions that will lead them to the correct graph. Graphs included in the resource are; bar, line, scatter plot, histogram, and pie chart. This PDF is formatted to print 3 slips er 8 1/2 by 11 page. These are the perfect size for bookmarks or for interactive notebooks.
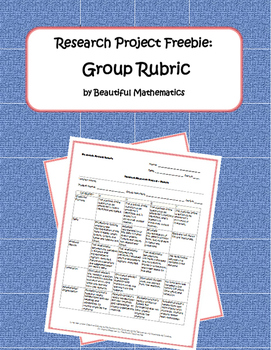
Research Poster Project Freebie
This research project rubric is part of a larger lesson plan for creating research poster projects. Check it out here: Algebra Research Project: Interpreting Functions.Please follow me to hear about new discounts, freebies and product launches. Visit my Beautiful Mathematics Store for more engaging math lessons. Provide feedback and get TPT credit on future purchases: Go to your My Purchases page. Click on the Provide Feedback button beside each purchase. You will be taken to a page where you
Showing 1-19 of 19 results


