174 results
High school Earth Day statistics laboratories
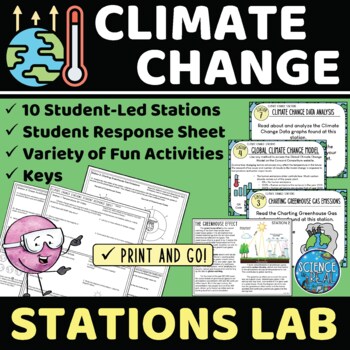
Climate Change Stations Lab - Student-Led Climate Change Stations
⭐ ⭐ ⭐ ⭐ Student-led lab stations are a great way to get your kids moving and interacting with content in a variety of fun and engaging ways! Students will learn, interact, and engage with new content about climate change, global warming, and the greenhouse effect! These ten stations focus on greenhouse gases, carbon dioxide emissions, greenhouse effect, and the causes and effects of climate change. All stations are neatly presented, have easy to understand directions, and require minimal prep fr
Subjects:
Grades:
8th - 12th
Types:
NGSS:
HS-ESS2-4
, MS-ESS3-5
, HS-ESS3-1
, HS-ESS3-5
, HS-ESS3-6
...
Also included in: Earth Science Stations Labs Growing Discount Bundle
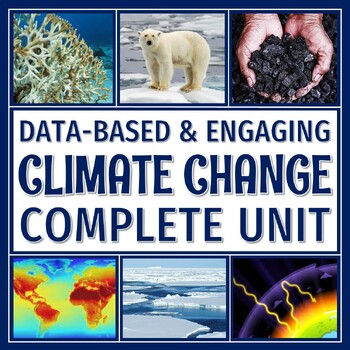
Global Warming Climate Change Unit Text Activity Quiz Test Lesson Plan Bundle
SAVE OVER 45%! This climate change unit is engaging, data-driven, and provides a large variety of activities and assessments. EVERYTHING YOU NEED TO TEACH A COMPREHENSIVE CLIMATE CHANGE UNIT IS INCLUDED. All of the work has been done for you - from start to finish! Reflect the rigor of NGSS with the included texts, engaging activities, and assessments. This unit has a little bit of everything, even a sub plan. The resources included provide numerous opportunities for data analysis and cri
Subjects:
Grades:
7th - 10th
Types:
NGSS:
MS-ESS3-5
, MS-ESS3-4
, HS-ESS3-5
, HS-ESS3-4
Candy Probability: Discovery of EXPERIMENTAL vs. THEORETICAL Probability
Middle Schoolers LOVE probability!
This is a GREAT lesson around Halloween when the kids are already hyped up on sugar and want to 'talk' to their classmates.
This activity allows the students to DISCOVER the differences between EXPERIMENTAL and THEORETICAL probability and connect it to everyday experiences. The probability lesson lends itself to fractions, decimals, percents, data collection, rational & irrational numbers, statistical graphs (box and whiskers, frequency tables...), measu
Subjects:
Grades:
5th - 9th
Types:
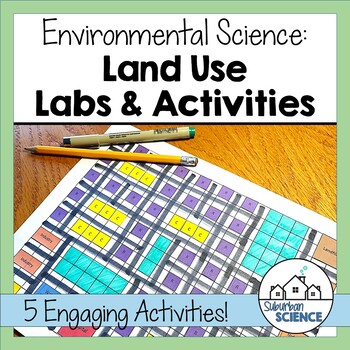
Human Impact on Environment Activities: Land Use, Urbanization, & Sustainability
This is an engaging bundle of environmental science activities on land use and urbanization. Students will learn about urban planning, heat islands, the history of urbanization, impacts of cities & climate change. Human impacts on the environment are interwoven throughout these lessons to provide students with a good basis for any environmental science or APES course. This activity set is the perfect addition to a sustainability unit in a high school Environmental Science course. Teacher pag
Subjects:
Grades:
10th - 12th
Types:
NGSS:
HS-ETS1-3
, HS-ESS3-3
, HS-ESS3-1
, HS-ESS3-4
, HS-ETS1-1
Also included in: Environmental Science Lab and Activity Bundle for High School
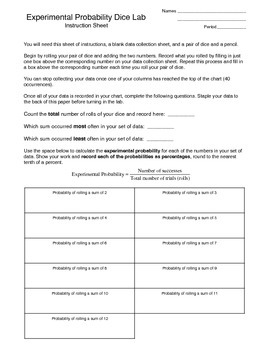
Experimental Probability Activity (dice lab)
In this activity students work with a partner to roll a pair of dice (many times) and record the sum of the dice in a data collection sheet. Once the data has been collected the students are walked through the process of calculating the experimental probability for each sum and then the theoretical probability for each sum and are asked questions about the differences they find between the values. Students also make a bar graph using the percentages for theoretical probability and can visually s
Subjects:
Grades:
7th - 11th
Types:
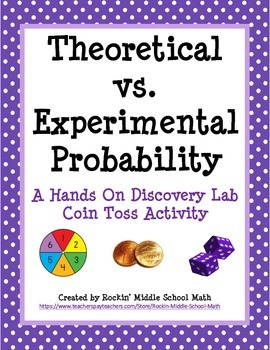
Theoretical vs Experimental Probability Lab (includes making predictions)
This is a fun, student-centered activity in which students working with a partner will conduct an experimental lab tossing 2 coins. After completing the lab, they will draw conclusions based upon the results of the activity concerning the difference between theoretical and experimental probability. Then they use experimental probability to make predictions. I have included the lab activity, a follow-up worksheet which can be used to engage student discussion after the lab, and a worksheet for
Subjects:
Grades:
6th - 9th
Types:
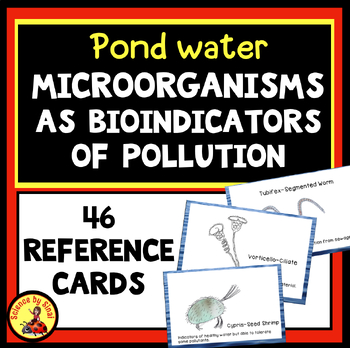
Pond Water MICROORGANISMS BIOINDICATORS of Water Pollution 46 Reference
Students observe and identify pond water microorganisms with microscopes to determine if it is polluted or not. Here are 46 reference cards of protists and invertebrates with pollutant tolerance levels indicated. Some common protists and pond organisms can be used as bioindicators. Are you studying MS-ESS3-3 or HS-ESS3-4 and discussing the impact that humans have on our waterways? For years I have taken my middle school classes to a nearby pond to collect organisms to look at under the microsc
Subjects:
Grades:
7th - 9th
Types:
NGSS:
MS-ESS3-3
, HS-ESS3-4
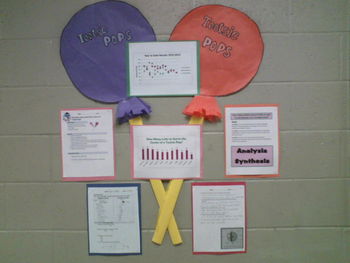
How Many Licks to the Center of a Tootsie Pop? Statistics!
Looking for novel way to get your middle school students excited about math and statistics?!
This file contains everything you need to conduct the experiment (except the Tootsie Pops!) that answers the age old question "How many licks does it take to get the center of a tootsie pop?" The lesson covers mean, median, mode, range, outliers, tables, graphs, box and whisker plots, data collection, pre and post discussion questions, experimental procedures, and student reflection. I also provided a s
Subjects:
Grades:
6th - 9th
Types:
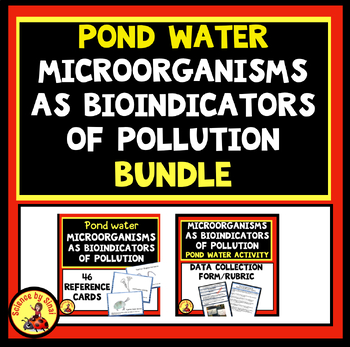
Microorganisms as BIOINDICATORS OF WATER POLLUTION In a Pond Activity BUNDLE
Here is a set of 46 bioindicator microorganism identification cards for students to use as they search for creatures using microscopes looking at pond water. Also included is a data collection form and a final project rubric. Please see the descriptions and previews of each of the two products.
Subjects:
Grades:
6th - 9th
Types:
NGSS:
MS-ESS3-3
, HS-ESS3-4
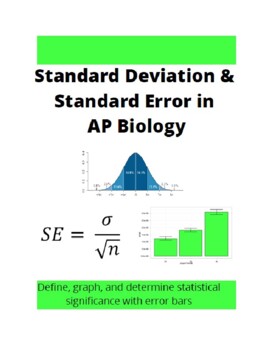
Standard Error and Standard Deviation in AP Biology
Statistics is one of those components in AP Biology that is brand new to students.Without a proper introductory lesson to standard error and standard deviation, students can struggle with this all year. Fortunately, this lesson truly walks your students through the process of defining standard deviation and error, applying the concept of error bars with statistical analysis, and graphing data with error bars to make their own statistical analysis. A PowerPoint is included as well to guide the le
Subjects:
Grades:
11th - 12th
Types:
Graphing Activity: Historic CO2 Levels (Paleoclimate)
A great activity for Earth Day in the middle school, or for teaching climate change in an Earth Science class!----------------------------------------------------Middle school students often know that CO2 levels on earth are rising, and that there is a lot of concern about how the climate will change as a result of this increase.However, most students are not aware of the historic and cyclical changes of CO2 here on Earth that affect history climates, often referred to a Paleoclimate.-----------
Subjects:
Grades:
6th - 9th
Types:
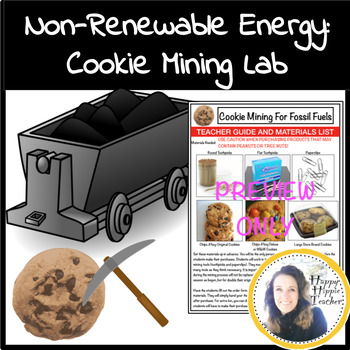
Nonrenewable Energy Resources - Cookie Mining Activity
THIS RESOURCE IS PART OF MY EARTH BUNDLE FOR A BIG DISCOUNT! Give your students a hands on and authentic learning experience as you study the processes behind obtaining fossil fuels. This cookie mining lab provokes students to strategize, work collaboratively, and gain understanding on the difficulties with mining nonrenewables for energy resources. ~~~~~~~~~~~~~~~~~~~~~~~~~~~~~~~~~~~~~~~~~~~~~~~~~~~~~~~~~~~~~~~~~~~~~~~~~~~~~~~~~~~~~~~~~~Students will have a change to analyze and interpret seve
Subjects:
Grades:
4th - 12th, Higher Education, Adult Education
Types:
Also included in: Environmental Science Bundle - Repurposing Project and Lab Activities
Water Conservation Lab: Design & Carry Out a Study - NGSS: Distance Learning
In this activity NGSS (Next Generation Science Standards) aligned activity, students (Part 1:) design and carry out a study to calculate how much water will be saved if they turn the water off while brushing their teeth, and (Part 2:) design and carry out a loner-term study at home to calculate how much water can be conserved. The lesson proceeds as follows: 1. First, students watch a short video on water conservation, and the growing water shortage crisis worldwide. They answer a few questio
Subjects:
Grades:
5th - 12th

Sickle Cell Data Analysis: Hardy-Weinberg and Chi-Square
Want a great way to convert the "traditional" Hardy-Weinberg lab into a data problem set? Here it is! This is ideal for very small classes, where sample size could be an issue, busy classes, where you may need this for additional at-home practice, or very large classes, where the swapping of H-W cards could get too messy.Included is the full data problem set and teacher pages with the answer key.This data problem set covers:-genotypes and phenotypes-the Hardy-Weinberg equation, with application
Subjects:
Grades:
10th - 12th, Higher Education
Types:
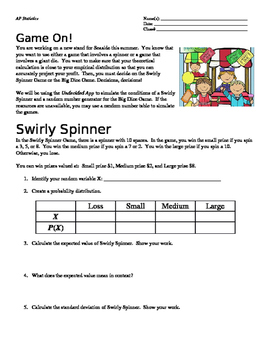
Game On! Hypothesis Testing: 1-Sample t-Test for Means Lab
This lab asks students to apply concepts of 1-sample t-test of means in a real world context. They are able to play/simulate games and determine if their theoretical calculation is accurate.
This lab integrates hypothesis testing based on two carnival games. Spiraling expected value and random variable topics from previous chapters will help themto prepare them with a "big picture" when it comes to the AP Statistics Exam.
(For the high flyers: It also asks students to develop of higher orde
Subjects:
Grades:
10th - 12th
Types:
Mission to Mars Lab: Design a Ship to Feed Astronauts |NGSS| Distance Learning
This ecology project is packed full of NGSS standards, and engages students in STEM activities. It proceeds as follows:1. First, students consider the hurdles involved in a manned-trip to Mars2. Then, students use concepts in ecology to design and create a self-sustaining food room for astronauts3. Finally, students evaluate the strengths and weaknesses of their mini-ecosystem Time Frame: The initial set up of the project requires one or two classes. Students can then make observations for a f
Subjects:
Grades:
6th - 12th
Types:
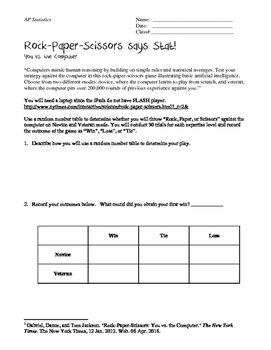
Rock, Paper, Scissors says Stat: A Chi-Square Lab
Students will utilize a Rock, Paper, Scissors website provided by the New York Times to determine whether the computer throwing Rock, Paper, Scissors is truly random. Students are asked to play the game 30 times in both modes. In addition, students are asked to call back ideas of simulation and probability to review previous learned concepts in preparation for the AP Exam to eliminate the confounding variables associated with human behavior.Please find an updated link to the simulator here: ht
Subjects:
Grades:
9th - 12th, Higher Education
Types:
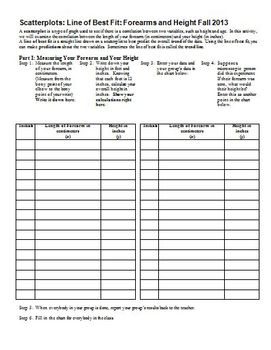
Scatterplots Linear Regression Line of Best Fit Forearms & Height (Editable)
After teaching my students about scatterplots, correlation, and the line of best fit, I take a day for them to do a hands-on lab, in which they measure their height (in inches) and their forearm length (from the tip of their elbow, to the bony point on their wrist), and we plot the class data, write the equation of the line of best fit, and then use the equation generated both forwards and backwards. They will need 45 minutes to an hour to do this in class.
I have found that if the students br
Subjects:
Grades:
7th - 12th
Types:
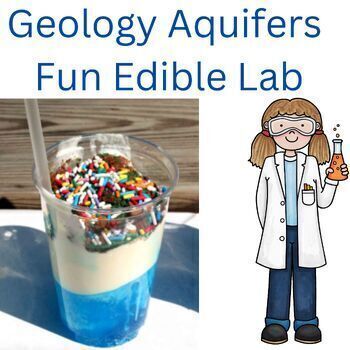
Geology Aquifers fun edible lab Middle School Science and Homeschool
Do your middle school science students love to eat candy in school? Do not fight it but embrace it by having them build an edible aquiferThis lesson is terrific both for the classroom teacher and homeschoolMake science FUN Included in this lesson is1. Prelab with questions2. Detailed instructions on the materials and procedure3. Extension if you would like to have your students go further into the subject Materials Clear plastic cupsIce cream scoopSpoonsDrinking straws Blue/red food coloringV
Subjects:
Grades:
6th - 9th
Types:
NGSS:
MS-ESS3-1
Also included in: Earth Science Geology Bundle for Middle School Science & Home School

Google Earth: Latitude & Longitude Lab
Have your students travel the world on Google Earth while learning about Latitude and Longitude! Students will use Google Earth to search for various locations throughout the lab and state their latitude/ longitude locations. Students will end by answering questions based on latitude/ longitude diagrams from the NYS Earth Science Regents Exam. Perfect for Distance Learning!
Subjects:
Grades:
8th - 12th
Types:
Also included in: Earth Science Starter Pack!
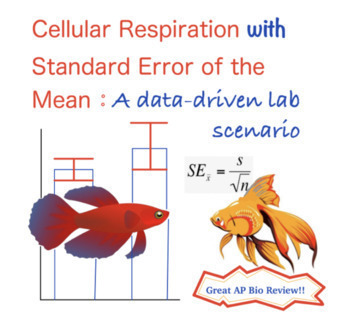
Cellular Respiration Think-it-Through Lab with Standard Error
This activity allows students to review basic concepts of cellular respiration in the context of a lab scenario. Students will work with data and complete calculations including percent change, mean, standard deviation, and standard error. In addition, students will see how error bars are drawn and learn how to interpret them on a graph. Activity A: Introduction (background, lab design, etc)Activity B: Working with data (percent change and mean calculations)Activity C: Calculating standard e
Subjects:
Grades:
9th - 12th, Higher Education, Adult Education
Types:
Also included in: Cell Resp Think-It-Through Lab with Standard Error and Answer Key
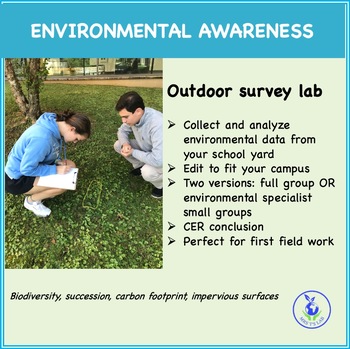
Outdoor Survey | Environmental Awareness
Get students outdoors and analyzing your schoolyard environment with this survey activity using simple data-collecting tools. Introduce students to biodiversity, carbon footprints, and succession, concepts that you can build on in subsequent activities. Perfect for the start of the school year in environmental science or APES. This newly updated resource includes two versions of the activity, a full-group expedition OR a group activity where students become environmental specialists. Both ar
Subjects:
Grades:
9th - 12th
Types:
NGSS:
HS-LS2-6
, HS-LS2-2
Also included in: APES Unit 1 | Living World Ecosystems Bundle
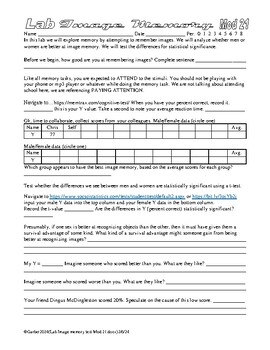
Psychology Lab Image Memory and Sex Differences AP Psychology Statistics
In this set of 13 labs the students do a variety of image memory tasks. They then collaborate and share data, then perform a T test on the data to find out if the differences between the scores of men and women are statistically significant. The students also test for correlations between a variety of scores. I suppose it is a sort of an expansion on my face memory lab. Links sometimes die, so try before you buy… https://www.psychologytoday.com/us/tests/iq/memory-test https://memtrax.com/cogniti
Subjects:
Grades:
9th - 12th, Higher Education, Adult Education
Types:
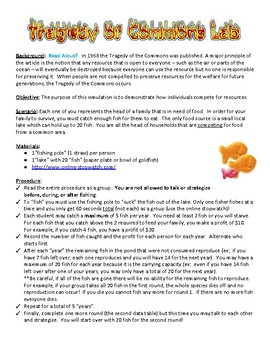
Tragedy of the Commons Lab - Human Impact on the Environment
In 1968 the Tragedy of the Commons was published. A major principle of the article is the notion that any resource that is open to everyone – such as the air or parts of the ocean – will eventually be destroyed because everyone can use the resource but no one is responsible for preserving it. When people are not compelled to preserve resources for the welfare for future generations, the Tragedy of the Commons occurs. Objective: The purpose of this simulation is to demonstrate how individuals co
Subjects:
Grades:
4th - 10th
Types:
Showing 1-24 of 174 results


