43 results
Middle school graphing rubrics under $5
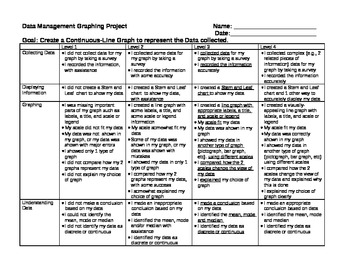
Grade 6 Graphing Project Rubric - Ontario
This is a rubric for a graphing project based on the Grade 6 Ontario Curriculum. It covers all points from the Grade 6 Data Management related to graphing (not probability), EXCEPT - determining how well the data represents a bigger population.
Download the preview to see a sample that one of my students made.
The project I did with my class was:
-collect data by doing a sample, research or experiment
-create a tally chart, stem and leaf plot, and t-chart showing the data
-create a continuou
Grades:
6th
Types:
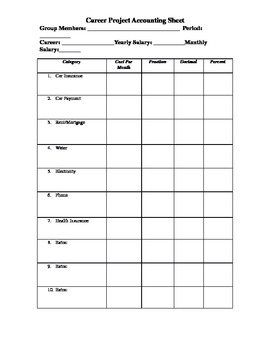
Career Monthly Bils Circle Graph Project
In this project students draw a career and select 10 of their monthly bills. They then figure what percent of their monthly salary goes to each item and create a circle graph showing where their money goes. The file you will receive includes a rubric for the project, an accountability sheet, 24 "career cards", a list of choices for the 7 required and 3 choice items in the project, and teachers notes about how the project has been made successful in their class. It is a word document so any of th
Subjects:
Grades:
6th - 8th
Types:
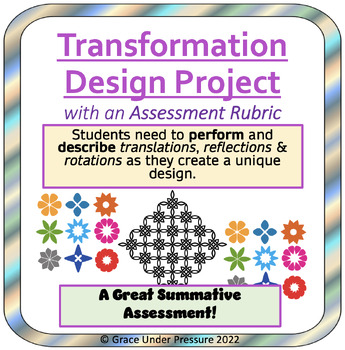
Transformation Geometry Project with an Assessment Rubric: Gr 6-8 Geometry
This creative and fun math geometry project assesses students’ ability to perform and describe 3 kinds of transformations: translations, rotations, and reflections. It is a great summative assessment for your transformation unit!It will take several work periods for students to create their design and write or type a detailed explanation of the process. This is how I can really see if they understand the concepts. I encourage students to describe their process using specific mathematical vocabul
Subjects:
Grades:
6th - 8th
Collecting, Organizing and Interpreting Data Assignment -Data Management Digital
In this culminating task, students will create a survey question, organize their data using frequency tables, graph their data and interpret their results. They will also find the mean, median, mode and range of the data.This is assignment asks students to create a presentation that will include the following:A survey questionMean, Median, Mode and Range of the dataFrequency table for the data3 different visual representations of their findingsInterpretation of the resultsThis product includes
Grades:
4th - 8th
Types:
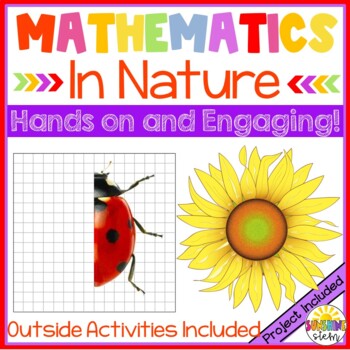
Mathematics in Nature {CCSS Math and NGSS Aligned}
Students explore and apply the principles of mathematical patterns in nature in a fun and engaging way! First, students identify and describe patterns in the natural world before heading outside to find patterns on their own. Next, students begin to explore number patterns in nature using the Fibonacci sequence. Fin fingerprint activity keeps students interested and engaged! Next, explore cycles in nature by creating a model on paper using 3-dimensional objects. Rubric included. Students are
Grades:
4th - 7th
Types:
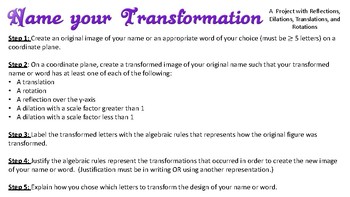
Transformations Project - Translations, Rotations, Reflections, and Dilations
This short project called "Name your Transformation" is designed to give students the opportunity to create a graphical image of their name or word of their choice and then transform it in a way that creates a fun design of their name or word. Steps and criteria are provided for students to transform the figures or letters of their name/word and justify their work. Graph paper is provided for their original image but students are encourage to complete their transformed image on a larger grid pap
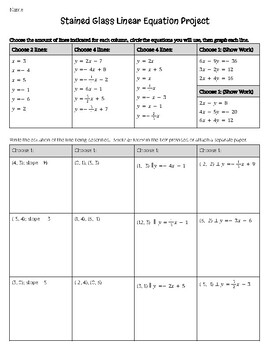
Stained Glass Linear Equations Project
This project allows students to show their knowledge of graphing linear equations as well as writing linear equations. Equations and problems are provided for students to choose from so that each student can make their own original stained glass window by graphing 15 linear equations.Students are provided with lists of linear equations to choose from to graph. Equations include: horizontal and vertical lines, equations in slope-intercept form (positive, negative, fractional, and whole number s
Grades:
8th - 9th
Types:
CCSS:
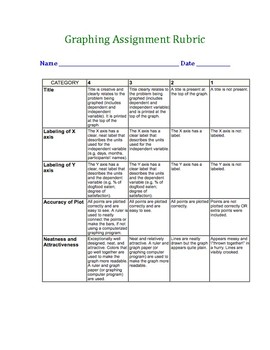
Graphing Rubric for Student Graphs
see preview.....check preview!100 WORD SEARCHES HERE!!!!!THIS RESPONSE JOURNAL MIGHT BE HELPFUL, TOO!POSTERS FOR YOUR CLASSROOM!GREAT RUBRIC BUNDLE!MY BEST PRODUCT-BUSINESS CLASS!GOOD CHARACTER WORD SEARCH!GROUP WORK SELF-EVALUATION!SOCIAL STUDIES BUNDLE…Lots of presentation rubrics!
Subjects:
Grades:
7th - 12th
Types:
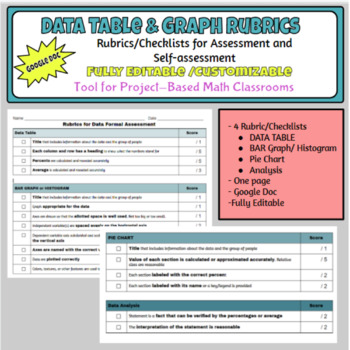
Data Table & Graph Assessment Rubrics/Checklists
4 Assessment Checklists/Rubrics for the following math and science skills: Making Data TablesMaking Bar Graphs/ HistogramsMaking Pie Charts/Circle Graphs (This is a WORKSHEET on HOW TO MAKE PIE CHARTS)Making Analysis Statements from DataFully editable Google Doc
Grades:
6th - 12th
Types:
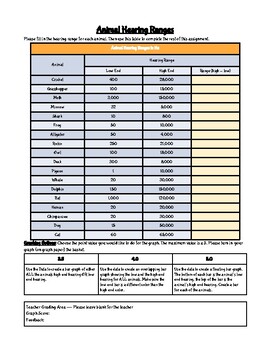
Graphing Animal Hearing Ranges (Scaffolded graphing)
This worksheet has students look at a variety of animal hearing ranges and then graph (leveled options) the hearing ranges and answer questions using the data.
Grades:
6th - 10th
CCSS:
NGSS:
MS-LS1-3
, MS-LS1-4
, MS-LS1-8
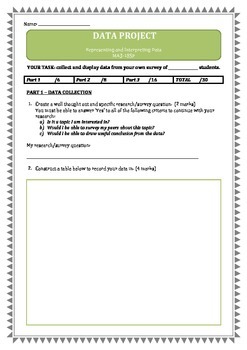
DATA & GRAPHING ASSESSMENT (Australian National Curriculum)
This assessment is designed to meet the Australian National Curriculum outcome MA3-‐18SP (Representing & Interpreting Data).
Students need to have prior knowledge of creating survey questions, conducting a survey, recording data and how to display data in a variety of graphs. I allow my students three days to complete the assessment, one day per section to ensure and encourage high quality work.
Students are required to do the following to complete this assessment:
Part 1 (collect data)
Subjects:
Grades:
5th - 6th
Types:
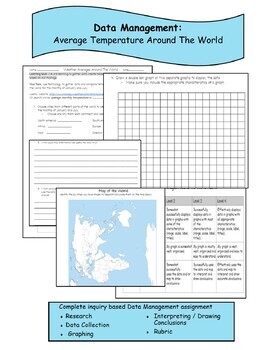
Data Management Assessment-Average Temp Around The World -Distance Learning
This comprehensive Data Management assessment incorporates real life application and authentic learning. This activity can be used as a formative assessment during a unit, after a unit or part of your math centers. It incorporates inquiry and research to engage and stimulate learning.It includes:ResearchData CollectionGraphingInterpreting, Analyzing and Drawing ConclusionsRubric
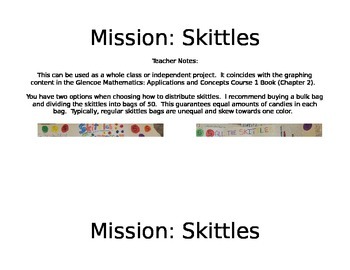
Skittles Graphing Project
This project is all about graphing! Using skittles, students will graph a frequency table, bar graph, circle graph, stem and leaf plot, and find the mean, median, mode, and range of a set of data. They will also have to survey classmates to gather data!
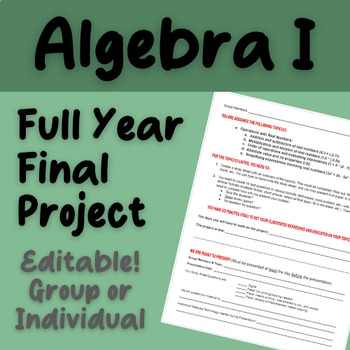
Algebra I - Full Year Final Review Project + Rubric
Engage your Algebra I students in a comprehensive review of the entire year's curriculum with this interactive and collaborative project. The "Algebra I - Full Year Review Project + Rubric" is a dynamic and hands-on activity designed to help students solidify their understanding of key concepts, reinforce problem-solving skills, and boost their confidence before heading into final assessments.This project is perfect for both group work and individual assignments, allowing students to demonstrate

PBL Math project Education vs. Wages
The information provided is a guide to giving your students some freedom and choice in a project based on seeing the value of education in their future.
Subjects:
Grades:
4th - 9th
Types:
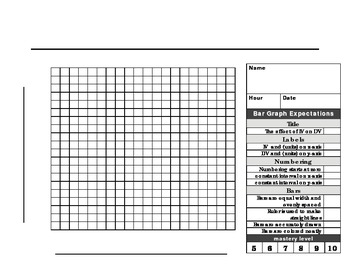
Bar Graph paper and rubric
This 20 X 20 graph paper with rubric is made for a beginner scientist to make a the perfect BAR graph. The checklist format makes it easy for students to know what is expected when graphing. Enjoy!
Subjects:
Grades:
1st - 12th, Higher Education, Adult Education
Types:
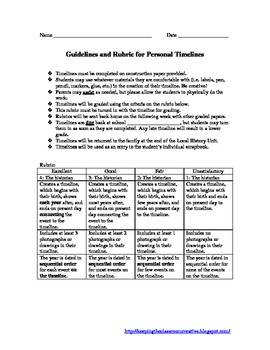
Student Timeline
This is a guide for student creation of a personal timeline. It is connected to Ohio standards in History under Historical Thinking. Timelines are to be completed on construction paper provided by the teacher.
Students may use whatever materials they are comfortable with (i.e. labels, pen, pencil, markers, glue, etc.) in the creation of their timeline. Let them be creative!
Parents may assist as needed, but please allow the students to physically do the work.
Timelines are then graded using the
Grades:
2nd - 6th
Types:
Valentines Day Coordinate Plane Project-All four quadrants
This is an open ended kind of project to allow students to be creative on the coordinate plane. An example is attached that you can show your students. A rubric is attached to the document so that you can grade this if you choose, and your students know what to expect about how this will be graded. I use this project every year for my 6th grade students, and they love the choice of creativity that this project offers. Students can complete this on blank graph paper. I always require the followin
Subjects:
Grades:
5th - 8th
Types:
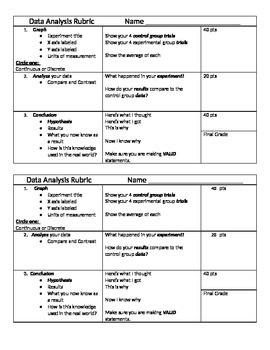
Rubric for Graph and Data Analysis
Use after students have collected data and information from a hands on experiment/lab. The students create a graph from their data collection table and write their results and reflection under it. This is a good companion piece to my Student Experiment/Lab Form. The upload includes two mini rubrics to attach to the student's work.
Subjects:
Grades:
5th - 8th
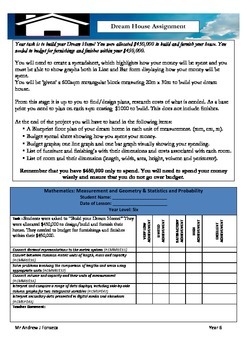
21st Century Math Project - Measurement + Geometry & Statistics + Probability
21st Century Math Project
Measurement + Geometry & Statistics + Probability
Exciting and engaging project based learning.
Package includes:
- Task outline
- Student check list rubric
- Teacher Rubric based on Australian Curriculum & Judging standards
Subjects:
Grades:
5th - 7th
Types:
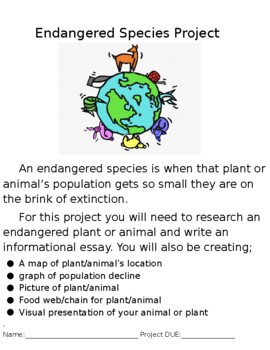
Endangered Species Project
This project encompasses writing about endangered animals. It conforms to NGSS standards as well as Common Core standards for ELA and Math (California). It contains a rubric, graphic organizer, and examples for students. This project can be edited to fit your classroom needs.
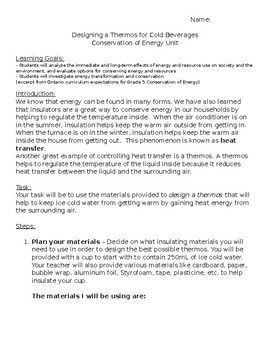
Conservation of Energy - Design a Thermos Project
This project was originally designed to align with the Ontario Grade 5 curriculum expectations for the conservation of energy unit, however can be adapted to meet other curriculum needs easily.
Includes:
- Learning Goals (curriculum expectations)
- Introduction about Conservation of Energy and the concept of heat transfer
- Detailed steps to carry out the project (students won't miss a step and will stay organized)
- Clear, detailed rubric for grading purposes
Materials needed:
- Cups
- Cold w
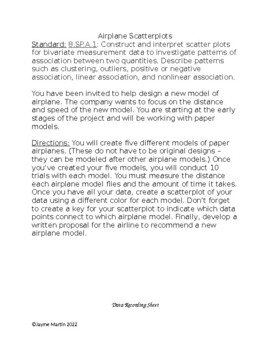
Airplane Scatterplots
This project gets students actively engaged by having them create model airplanes, fly them, measure the distance and use scatterplots to display the data and find trends. Great way to make the assignment come alive.
Functions and Graphs Learning Framework | 41 levels | self-paced work plan
This Functions and Graphs Level-up learning framework includes 41 levels and is geared towards helping students learn to deal with more and more advanced problems. The framework includes 213 unique links to support students when they cannot complete the problems in a given level. There are then also links to sources which have relevant problems to ensure that students have a strong grasp on the relevant level of functions and graphs. There is also supportive images included to explain some of th
Subjects:
Grades:
4th - 12th
Types:
Also included in: Algebra | Functions & Graphs Learning Frameworks | 65 levels
Showing 1-24 of 43 results


