5 results
3rd grade graphing outlines for Microsoft Word

Bubble Gum LAB
Students will walk through the scientific process, learn about mass and use a triple beam balance while doing a bubble gum activity.
Subjects:
Grades:
2nd - 8th
Types:
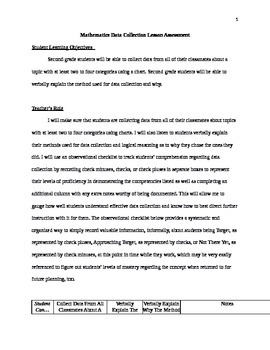
Mathematics Data Collection Lesson Assessment
This is one assessment of an observational checklist for the basic mathematics lesson regarding data collection that is most appropriate for first through fourth grade students with minimal modification needed, if any at all, but could be adjusted for many other grades. The lesson targets two principal objectives: students will be able to collect data from all of their classmates about a topic with at least two to four categories using a chart and students will be able to verbally explain the me
Subjects:
Grades:
1st - 4th
Types:
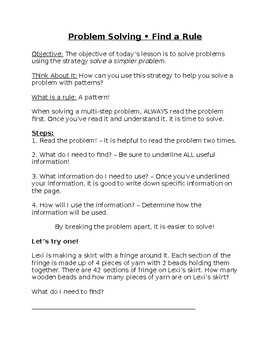
Problem Solving - Find a Rule
Goes along with the Go Math textbook. In depth rules (great for a hand out/ refresher at the beginning of a lesson) and practice problem. This product is editable, and you can change the numbers & difficulty of the problem depending on grade and/or student skill level.
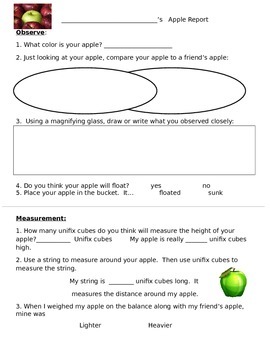
Apple Science Report Organizer
During students' lessons on apples, this paper helps students investigate apples as they use their senses to observe apples.
Using three types of apples, students will:
*learning to use magnifying glasses
* Draw diagrams and label
* Compare and contrast
* taste test and use describing words
* graph favorite apple.
*practice measurement
Afterwards, students can do an opinion writing piece about apples.
Subjects:
Grades:
1st - 3rd
Types:
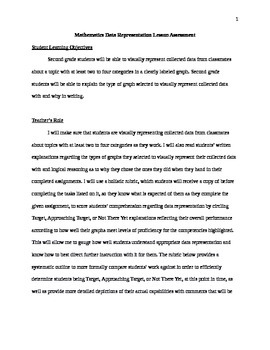
Mathematics Data Representation Lesson Assessment
This is one assessment of a holistic rubric for the basic mathematics lesson regarding data representation that is most appropriate for first through fourth grade students with minimal modification needed, if any at all, but could be adjusted for many other grades. The lesson targets two principal objectives: students will be able to visually represent collected data from classmates about a topic with at least two to four categories in a clearly labeled graph and students will be able to explain
Subjects:
Grades:
1st - 4th
Types:
Showing 1-5 of 5 results


