42 results
Adult education statistics lectures $5-10
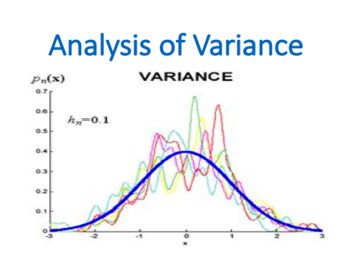
Analysis of Variance (ANOVA) (Statistics)
Analysis of Variance (ANOVA) is a lecture which is covered within the Statistic or Basic Business Statistic module by business and economics students.Analysis of variance, known by the acronym ANOVA, allows statistical comparison among samples taken from many populations. While ANOVA literally does analyze variation, the purpose of ANOVA is to reach conclusions about possible differences among the means of each group, analogous to the hypothesis tests of the previous chapter. Every ANOVA design
Subjects:
Grades:
5th - 12th, Higher Education, Adult Education, Staff
Types:
Also included in: Statistics Module Bundle
A Roadmap for Analyzing Data (Statistics)
A Roadmap for Analyzing Data is a lecture which is covered within the Statistic or Basic Business Statistic module by business and economics students. Choosing appropriate statistical methods for your data is the single most important task you face and is at the heart of “doing statistics.” But this selection process is also the single most difficult thing you do when applying statistics! How, then, can you ensure that you have made an appropriate choice? By asking a series of questions, you can
Subjects:
Grades:
5th - 12th, Higher Education, Adult Education, Staff
Also included in: Statistics Module Bundle
Statistics in Research found in Social Science
This google slide presentation teaches the understanding of statistics found in Social Science research. In this 19 slide presentation the following topics are covered…-Qualitative vs Quantitative Research-Mean, Median, Mode, Midrange, and Range-Curves and Distributions-Correlation-Control group, causatition, blind experiment, confederate etc…There are images and a few videos to highlight the talking points found in this presentation.This lesson is intended for Grade 11 and 12 students (cours
Subjects:
Grades:
9th - 12th, Higher Education, Adult Education
Intro to Statistics
This presentation covers applications of statistics, measures of central tendency (mean, median mode), quartiles, measures of dispersion (range, standard deviation), outliers, percentiles, intro the to Central Limit Theorem, the normal distribution, (bell-shaped curves), sample vs. population.Slides are animated and will walk through solving problems.Best taught over 2-3 lessons.
Subjects:
Grades:
7th - 12th, Higher Education, Adult Education
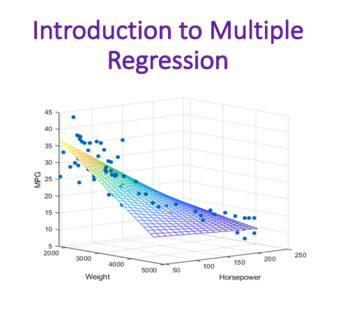
Introduction to Multiple Regression (Statistics)
Introduction to Multiple Regression is a lecture which is covered within the Statistic or Basic Business Statistic module by business and economics students.This lecture will introduce you to multiple regression models that use two or more independent variables to predict the value of a dependent variable. Learning objectives: · How to develop a multiple regression model· How to interpret the regression coefficients· How to determine which independent variables to include in the regression mode
Subjects:
Grades:
5th - 12th, Higher Education, Adult Education, Staff
Types:
Also included in: Statistics Module Bundle
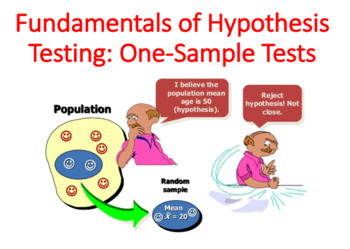
Fundamentals of Hypothesis Testing: One-Sample Tests
Fundamentals of Hypothesis Testing: One-Sample Tests is a lecture which is covered within the Statistic or Basic Business Statistic module by business and economics students. In this lecture, you will learn several applications of hypothesis testing. You will learn how to make inferences about a population parameter by analyzing differences between the results observed, the sample statistic, and many more. Learning objectives: The basic principles of hypothesis testingHow to use hypothesis testi
Subjects:
Grades:
5th - 12th, Higher Education, Adult Education, Staff
Types:
Also included in: Statistics Module Bundle
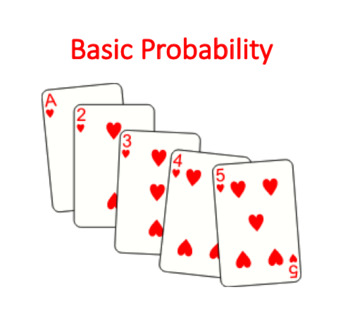
Basic Probability (Statistics)
Basic Probability is a lecture which is covered within the Statistic or Basic Business Statistic module by business and economics students.The principles of probability help bridge the worlds of descriptive statistics and inferentialstatistics. Probability principles are the foundation for the probability distribution, the concept of mathematical expectation, and the binomial, Poisson, and hypergeometric distributions, topics. In this lecture you learn to: Basic probability conceptsAbout conditi
Subjects:
Grades:
5th - 12th, Higher Education, Adult Education, Staff
Types:
Also included in: Statistics Module Bundle
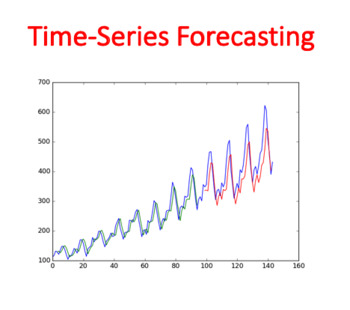
Time-Series Forecasting (Statistics)
Time-Series Forecasting is a lecture which is covered within the Statistic or Basic Business Statistic module by business and economics students. A time series is a set of numerical data collected over time. Due to differences in the features of data for various investments described in the Using Statistics scenario, you need to consider several different approaches for forecasting time-series data. This lecture begins with an introduction to the importance of business forecasting and a descript
Subjects:
Grades:
5th - 12th, Higher Education, Adult Education, Staff
Also included in: Statistics Module Bundle
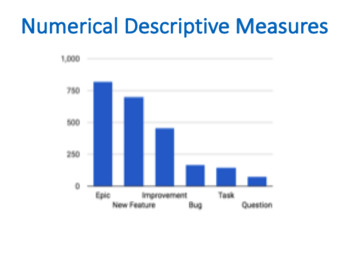
Numerical Descriptive Measures (Statistics)
Numerical Descriptive Measures is a lecture which is covered within the Statistic or Basic Business Statistic module by business and economics students. Central tendency is the extent to which the values of a numerical variable group around a typical, or central, value. Variation measures the amount of dispersion, or scattering, away from a central value that the values of a numerical variable show. The shape of a variable is the pattern of the distribution of values from the lowest value to the
Subjects:
Grades:
5th - 12th, Higher Education, Adult Education, Staff
Types:
Also included in: Statistics Module Bundle
Defining and Collecting Data (Business Statistics)
Defining and Collecting Data is a lecture which is covered within the Statistic or Basic Business Statistic module by business and economics students.Nowadays, Data playing an important role in the success of the company. Without reliable and proper data most probably company will fail, while by possessing good data company may get a competitive advantage over main competitors in the market. It is extremely important for future managers to understand how to collect as well as to analyze data, as
Subjects:
Grades:
5th - 12th, Higher Education, Adult Education, Staff
Types:
Also included in: Statistics Module Bundle
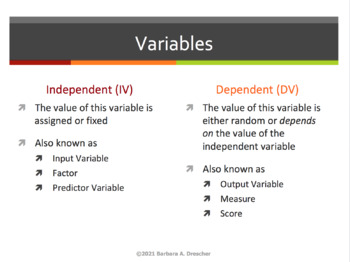
Statistics: Basic Concepts Review PPT Lecture and Resource Bundle
Fully editable PowerPoint Lecture (pptx) reviewing basic concepts. Appropriate for any level of statistics, including introductory. Fully fleshed-out notes, slide transition timing and "animation" when appropriate.Includes student handouts (pdf), printable lecture notes (pdf), learning objectives (pdf), and exam/quiz questions (pdf; 18 essay/short answer, 12 multiple choice, 12 which can be framed as either). Includes fun ESP "experiment". Topics covered: Variables: Independent and DependentRand
Subjects:
Grades:
9th - 12th, Higher Education, Adult Education, Staff
Estimating Parameters and Determining Sample Sizes Lecture ( Statistic Module)
Estimating Parameters and Determining Sample Sizes Lecture (Elementary Statistics Module)In this lecture we begin the study of methods of inferential statistics. The following are the major activities of inferential statistics, and this lecture introduces methods for the first activity of using sample data to estimate population parameters.Major Activities of Inferential Statistics1. Use sample data to estimate values of population parameters (such as a population proportion or population mean).
Subjects:
Grades:
8th - 12th, Higher Education, Adult Education, Staff
Hypothesis Testing Lecture (Elementary Statistics Module)
Hypothesis Testing Lecture (Elementary Statistics Module)In this Hypothesis Testing lecture we begin the study how to do different hypothesis testing in statistics. More details of this lecture objectives you may find bellow:Here are the lecture objectives:1. Basics of Hypothesis TestingDevelop the ability to identify the null and alternative hypotheses when given some claim about a population parameter (such as a proportion, mean, standard deviation, or variance)Develop the ability to calculate
Subjects:
Grades:
8th - 12th, Higher Education, Adult Education, Staff
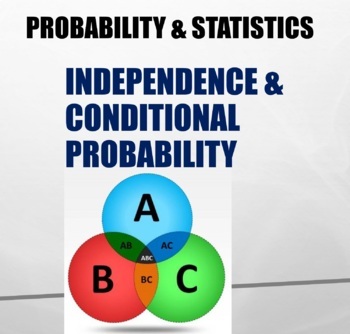
Probability & Statistics: Independence and Conditional Probability
Covers probability including:- Mutually exclusive events- Independent and dependent events ("A given B")- Unions- Intersections- Sampling with and without replacement- Addition Rule- Multiplication RuleExamples with die, cards, lottery and many others. Slides are animated, showing step-by-step how to perform calculations. I used these slides for my high school statistics class (10th-12th grade).
Subjects:
Grades:
10th - 12th, Higher Education, Adult Education
CCSS:
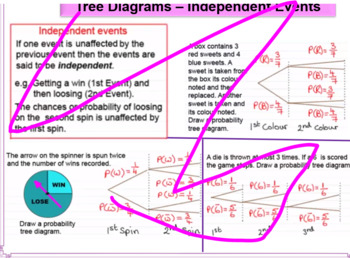
Tree Diagrams - Fully planned lesson
Fully planned lesson introducing Tree Diagrams to students including how to work out the different probabilities.Has simple Tree Diagrams as well as advanced Higher education examples and questions. Explanations of Dependent, Independent and Exclusive events. Also includes conditional probability.
Subjects:
Grades:
8th - 12th, Higher Education, Adult Education

Research Methods Module - Analyzing Qualitative Data
Research Methods Module - Analyzing Qualitative Data Lecture is covered by students who are writing final research projects.
Here is Outline of lecture:
What qualitative data gives us
General principles of analysis
Practical pointers
In this File you will find:
- 1 Research Methods - Analyzing Qualitative Data Lecture Power Point Presentation
- 2 Seminar Plan with different Exercises and case studies for practice
!!! Attention !!! for Seminars you are required to have access to NVivo Sof
Subjects:
Grades:
Higher Education, Adult Education
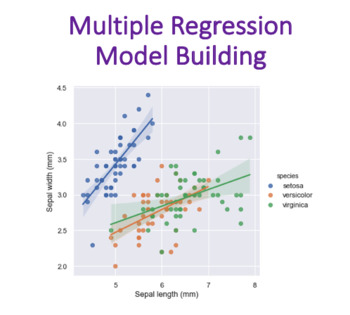
Multiple Regression Model Building (Statistics)
Multiple Regression Model Building is a lecture which is covered within the Statistic or Basic Business Statistic module by business and economics students.This lecture discusses multiple regression models with two independent variables. Moreover, this lecture considers regression models that contain more than two independent variables. Also lecture discusses model-building concepts that will help to develop the best model when confronted with a set of data that has many independent variables, s
Subjects:
Grades:
5th - 12th, Higher Education, Adult Education, Staff
Types:
Also included in: Statistics Module Bundle
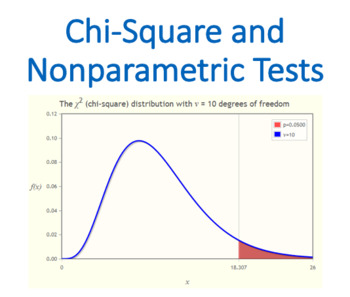
Chi-Square and Nonparametric Tests (Statistics)
Chi-Square and Nonparametric Tests is a lecture which is covered within the Statistic or Basic Business Statistic module by business and economics students.This lecture extends hypothesis testing to analyze differences between population proportions based on two or more samples and to test the hypothesis of independence in the joint responses to two categorical variables. The lecture concludes with nonparametric tests as alternatives to several hypothesis tests. Learning objectives: How and when
Subjects:
Grades:
5th - 12th, Higher Education, Adult Education, Staff
Types:
Also included in: Statistics Module Bundle
Organizing and Visualizing Variables (Business Statistics)
Organizing and Visualizing Variables is a lecture which is covered within the Statistic or Basic Business Statistic module by business and economics students.When you organize the data, you sometimes begin to discover patterns or relationships in the data. To better explore and discover patterns and relationships, you can visualize your data by creating various charts and special displays.Because the methods used to organize and visualize the data collected for categorical variables differ from
Subjects:
Grades:
5th - 12th, Higher Education, Adult Education, Staff
Types:
Also included in: Statistics Module Bundle
Business Analytics (Statistics)
Business Analytics is a lecture which is covered within the Statistic or Basic Business Statistic module by business and economics students. Descriptive analytics, predictive analytics, and prescriptive analytics form the three broad categories of analytic methods. Descriptive analytics explores business activities that have occurred or are occurring in the present moment. Predictive analytics identifies what is likely to occur in the (near) future and finds relationships in data that may not be
Subjects:
Grades:
9th - 12th, Higher Education, Adult Education, Staff
Types:
Also included in: Statistics Module Bundle
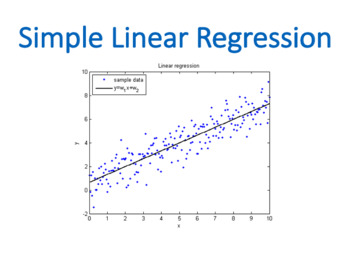
Simple Linear Regression (Statistics)
Simple Linear Regression is a lecture which is covered within the Statistic or Basic Business Statistic module by business and economics students.This lecture discusses simple linear regression models that use a single numerical independent variable, X, to predict the numerical dependent variable, Y. In this lecture, you will learn regression analysis techniques that help uncover relationships between variables. regression analysis leads to selection of a model that expresses how one or more ind
Subjects:
Grades:
5th - 12th, Higher Education, Adult Education, Staff
Types:
Also included in: Statistics Module Bundle
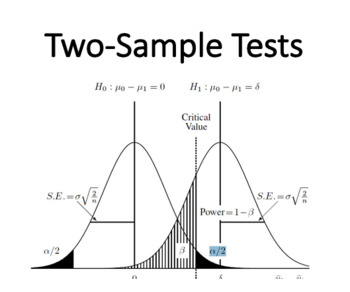
Two-Sample Tests (Statistics)
Two-Sample Tests is a lecture which is covered within the Statistic or Basic Business Statistic module by business and economics students.In this lecture, you will learn how to extend hypothesis testing to two-sample tests that compare statistics from samples selected from two populations. Learning objectives: • How to use hypothesis testing for comparing the difference between– The means of two independent populations– The means of two related populations – The proportions of two independent po
Subjects:
Grades:
5th - 12th, Higher Education, Adult Education, Staff
Types:
Also included in: Statistics Module Bundle
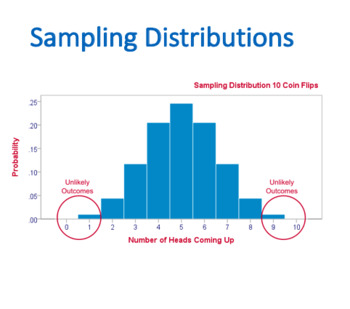
Sampling Distributions (Statistics)
Sampling Distributions is a lecture which is covered within the Statistic or Basic Business Statistic module by business and economics students.In many applications, you want to make inferences that are based on statistics calculated from samples to estimate the values of population parameters. In this lecture, you will learn about how the sample mean (a statistic) is used to estimate the population mean (a parameter) and how the sample proportion (a statistic) is used to estimate the population
Subjects:
Grades:
5th - 12th, Higher Education, Adult Education, Staff
Also included in: Statistics Module Bundle
21:42
Flipped Lecture - Ch19 One Proportion z-intervals
The following is part of flipped classroom for AP Statistics: One Proportion z-Intervals that completely explains the process and procedures and understandings required to successfully implement confidence intervals. While proportions are the parameter for this unit, many of the same ideas are used with One Sample t-Interval for Means.These videos are a complete lecture that is suitable to replace direct instruction in the classroom. The videos present statistics in an engaging and approachabl
Subjects:
Grades:
9th - 12th, Higher Education, Adult Education, Staff
Showing 1-24 of 42 results


