9 results
Adult education statistics printables $5-10
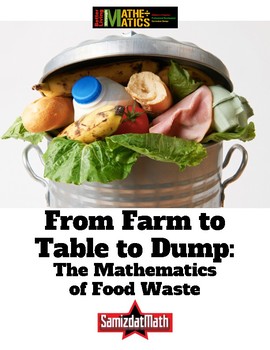
Food Waste and Mathematics: From Farm to Table to Dump
Here's a very uncomfortable fact: it takes 4 pounds of potatoes to make 1 pound of potato chips. That means that for every 1 pound bag of potato chips you eat, 3 pounds of potatoes have to be thrown away. What a waste of food! This is a series of activities that looks at the hidden world of food waste. It includes a look at how much food is wasted as it is "processed" into finished products like french fries and potato chips. It also includes mathematical activities where students calculate how
Subjects:
Grades:
5th - 12th, Adult Education
Types:
Cognitive Bias - Discussion Questions - Heuristics - Art of Thinking Clearly
This lesson bundle includes the discussion question worksheets for Chapters 21-30 of the Art of Thinking Clearly, covering the following topics:The Paradox of Choice Liking Bias The Endowment EffectCoincidenceGroupthinkNeglect of ProbabilityScarcity ErrorBase-rate Neglect The Anchor
Subjects:
Grades:
7th - 12th, Higher Education, Adult Education, Staff
Types:
Statistics - Medical Math - Probability Distributions and Hypothesis Tests
After learning about probability distributions (binomial, geometric, and normal), confidence intervals, and hypothesis tests, I know most students need extra time reviewing all of those application types of problems and understanding what those answers mean in context of the real world. I created this statistics application activity in line with a bunch of medical math styled problems to give this extra practice. In this resource you will get,* a pdf of the questions and answer key* 6 different
Subjects:
Grades:
11th - 12th, Higher Education, Adult Education
Types:
Also included in: Statistics (Full Year) - Additional Activities Bundle
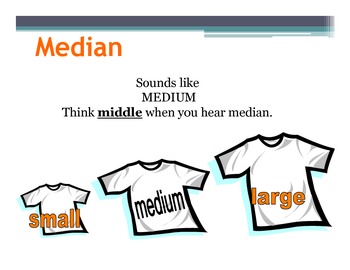
Math Posters:Mean, median, mode, range (30 Posters)
Mean, median, mode, range (30 Posters)
30 Beautiful and colorful posters.
I posted these posters in my classroom, and my students found the explanations very useful!!! (The last three slides are about Math songs (Mean, median, mode)
MY OTHER MATH POSTERS
Math Poster: SOHCAHTOA
Math Posters : Real Numbers
Math Posters : Tools For Algebra and Geometry (30 Posters)
Math Posters :Triangles (20 Posters)
Math Posters: 10 COMMON ERRORS IN ALGEBRA
Math Posters: Keywords of addition,subtraction
Subjects:
Grades:
4th - 12th, Higher Education, Adult Education, Staff

Statistical Math (GED REVIEW)
Statistical Math
Data analysis statistics and probability worksheets ,63 problems
GED Review
Fraction and Data (29 Multiple choice questions)
Statistic Problem (15 questions)
Probability Word Problems
This section contains 19 word problems about :
Simple Probability
Counting Principle
Independent Probability
Dependent Probability
Mutually Exclusive Events
Permutations
Combinations
Conditional Probability
* AlSO AVAILABLE FOR YOU OR A COLLEAGUE! - CLICK ANY LINK YOU WANT:
Geometry (GED R
Subjects:
Grades:
9th - 12th, Higher Education, Adult Education, Staff
Types:
Research Paper-integrating Math and Science
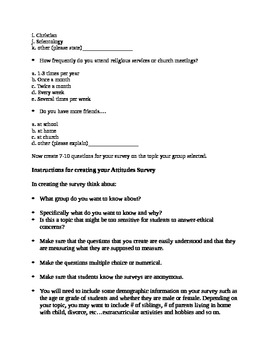
This is a research paper that breaks down the topic and methodology into sections. The project is student driven. Student groups decide on a reseach topic that they can actually research but also create a survey to administer to students in the school so that they are collecting their own data.
The booklet begins with students creating survey questions, but you may want to first have them do the intro to the paper and their hypotheses before creating the survey questions.
Science is integrate
Subjects:
Grades:
7th - 12th, Adult Education
Types:

Key Performance Indicators Data Dashboard - Graphic Organizer
Students follow along with the instructor's presentation slides by filling out the graphic organizer drawing and coloring the slides' data charts. Print on 11x17.Bundle includes presentation slides, printable graphic organizer for written practice, virtual graphic organizer for online practice, final project template and rubric.
Subjects:
Grades:
8th - 12th, Higher Education, Adult Education
Also included in: Key Performance Data Dashboards Bundle
Quadratics and Linear Regression Lab
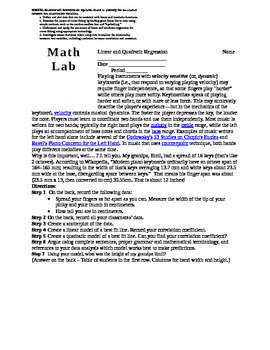
Students will compare and contrast width of hand to spread of keys on a piano. See the lab for more directions. Students will use tools with precision as well as create, analyze, evaluate and compare/contrast data.
Subjects:
Grades:
8th - 12th, Higher Education, Adult Education
Types:
Hand Calculating Pearson's Correlation (and in SPSS too!)
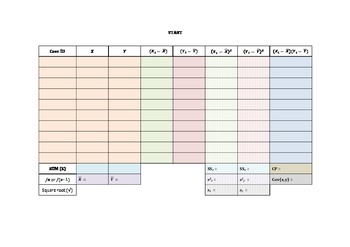
This set of slides provides an easy and colorful way to teach the hand calculation for Pearson's correlation. As a bonus, it also shows output for Pearson's correlation in SPSS, including testing assumptions and result interpretation. Even the most math afraid students will be able to follow this process!
Subjects:
Grades:
11th - 12th, Higher Education, Adult Education
Showing 1-9 of 9 results


