29 results
Statistics centers for Microsoft PowerPoint and for homeschool
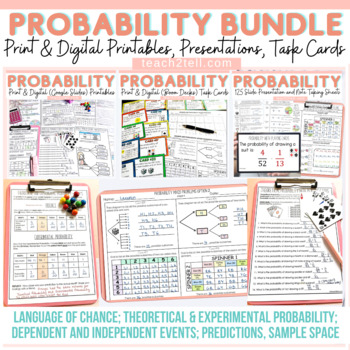
Chance and Probability Activities Theoretical & Experimental Probability Bundle
Are you teaching your students all about chance and probability and looking for fun hands-on probability activities? This print and digital bundle of worksheets, task cards, slideshows and note-taking sheets on Probability will reinforce the understanding of theoretical probability, experimental probability, language of chance, sample space, predictions, lists, tree diagrams, dependent probability events and independent probability events.Both US and British English spelling and terminology file
Subjects:
Grades:
4th - 7th
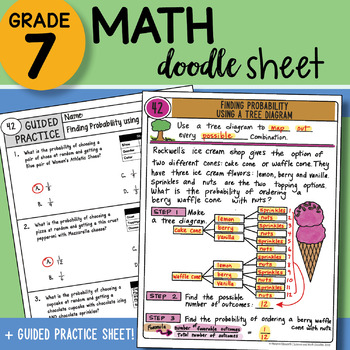
Math Doodle - Finding Probability using a Tree Diagram - Easy to Use Notes w PPT
7th Grade Math Doodle Sheet Product INCLUDES:Math Doodle Sheet - blank and keyGuided Practice Sheet - blank and keyPowerPoint – to show students the KEY– two versions of both sheets included: INB and large 8.5 x 11 size ALL TEKS Aligned– plan for the FULL year included with table of contents page for INB! SAVE BIG and buy the WHOLE YEAR SET found here:7th Grade Math Doodle Sheets ALL YEAR SET WHOLE YEAR SET List below:ALL TEKS Aligned– plan for the FULL year included! LIST of 88 Doodle Sheets p
Subjects:
Grades:
6th - 8th
Probability project using Real-World March Madness Tournament
Jump into the March Madness tournament to apply probability concepts to a real-world application. Great for your sports-loving students. Students explore probability first by determining the probability that a team will win. Students, further, weight teams based on historical data and/or team statistics. This mini-project allows for creative problem-solving and has some open-ended answers.Included in this resource:★ Student pages for 3 March Madness related activities★ Detailed guidelines fo
Subjects:
Grades:
7th - 10th
Types:
Also included in: 7th Grade Math Resource Bundle
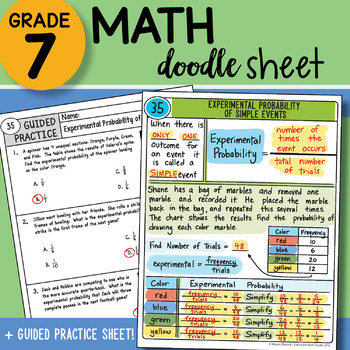
Math Doodle Sheet - Experimental Probability of Simple Events - Notes with PPT
7th Grade Math Doodle Sheet Product INCLUDES:Math Doodle Sheet - blank and keyGuided Practice Sheet - blank and keyPowerPoint – to show students the KEY– two versions of both sheets included: INB and large 8.5 x 11 size ALL TEKS Aligned– plan for the FULL year included with table of contents page for INB! SAVE BIG and buy the WHOLE YEAR SET found here:7th Grade Math Doodle Sheets ALL YEAR SET WHOLE YEAR SET List below:ALL TEKS Aligned– plan for the FULL year included! LIST of 88 Doodle Sheets p
Subjects:
Grades:
6th - 8th
Statistics, Probability, and Data Slide Show for Grades 3 and 4
The vocabulary and concepts included are sets, data, survey, tally, charts, diagrams, graphs, key, mean, probability, combinations, and tree diagrams.The 49 PowerPoint slides are a combination of teaching (lecture style) and interactive slides (matching, fill-in, multiple choice, etc).Also included is a Directions Page for using PowerPoint and for using the PEN OPTION of PowerPoint.The Preview File is pages 1-11 of the Slide Show so that you can "Try before you Buy".~~~~~~~~~~~~~~~~~~~~~~~~~~~~~
Subjects:
Grades:
3rd - 4th
Also included in: Math for Grades 3-4 PowerPoint Slide Show BUNDLE Math Vocabulary
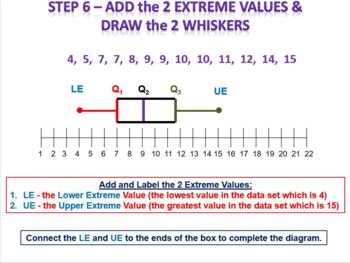
Math 1 / Algebra 1 Bundle - Unit 9 Statistical Measures and Data Analysis
This bundle includes various instructional MS PowerPoint (PPT) slidepacks that I initially use when covering the Math 1/Algebra 1 content area titled: Unit 9 - Statistical Measures and Data Analysis. The following slidepacks are included in this bundle:Box and Whisker Plot Analysis and Construction including Outliers General Statistics - Mean, Median, Mode, Range and Mean Absolute Deviation Mean, Median, Mode, Range and Standard Deviation SummaryScatterplots and Correlation SummaryTwo Way Frequ
Subjects:
Grades:
9th - 12th
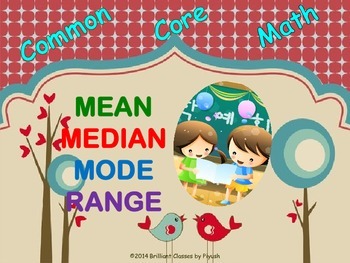
Mean - Median - Mode - Range -Understanding With Easy Steps!!!!
This power point presentation is prepared on statistical terms like mean, median, mode, and range. These terms describe properties of statistical distributions. In statistics, a distribution is the set of all possible values for terms that represent defined events.
The presentation is prepared in a very simple language with clear and simple example so that students of grades 3-4-5-6 can understand the concept smoothly. Easy steps for calculating the above terms will help students a lot in remov
Subjects:
Grades:
4th - 8th, Staff
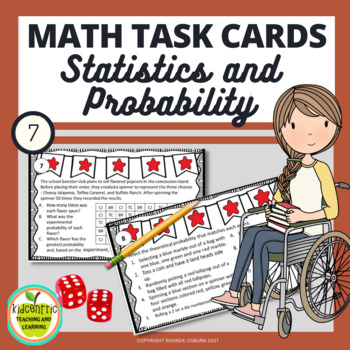
Math Task Cards - Statistics and Probability
Great versatile and engaging resource for reviewing the concepts of probability and statistics. Your seventh graders will be actively engaged as they use random sampling to draw inferences about a population, draw informal comparative inferences about two populations, and investigate, use, and evaluate probability models. There are many ways you can use these NO PREP cards with your 7th grade math class. Think how easily you can just print and use these cards with activities such as:Bellwork
Subjects:
Grades:
6th - 8th
Types:
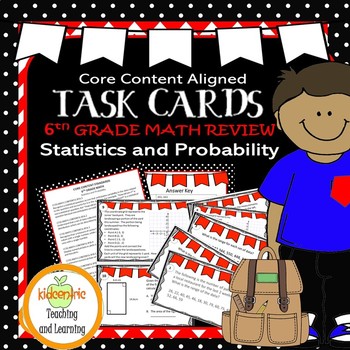
Math Task Cards 6th Grade Statistics Probability | Mean, Median, Number Lines
This set of Sixth Grade Math Task Cards review majors concepts of mean, median and the distribution of numerical data sets on a number line, including dot plots, histograms, and box plots. Checking your student's understanding of the Core Content Domain of Ratios and Proportional Relationships, the cards may be used by individual students, or as the basis for cooperative group work. Versatile and engaging, there are many ways you can use these NO PREP cards with your class. Think how easily y
Subjects:
Grades:
5th - 7th
Types:
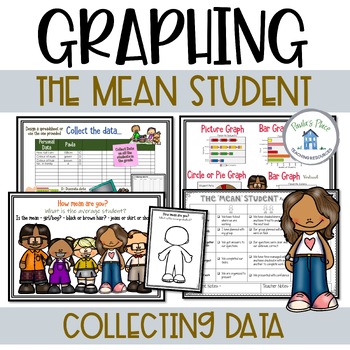
Graphing the Mean | Your Mean Student - Project Based Learning
Graphing the Mean - Your students will experience a math task that will lead to a group presentation. They will compose questions, collect data, collate data, determine the ‘mean’, show the data in various graphs and design a poster to present the ‘mean student’.Slides include-What the unit will cover-How mean are you? What will you be looking for?-What is the mean?-How mean are you?-Template for recording the mean student-Ideas for recording data-Group guidelines – it’s your turn-Types of graph
Subjects:
Grades:
4th - 6th

Probability : Possible Outcomes Powerpoint
This powerpoint introduces students to events and possible outcomes. This powerpoint can be used in a whole group setting or as part of a math center activity.
Subjects:
Grades:
3rd - 6th
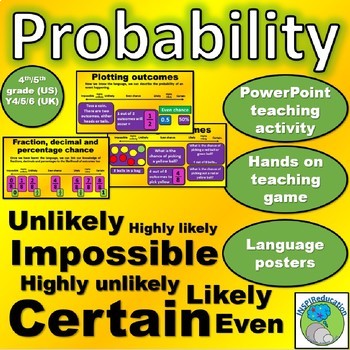
MATH Probability Teaching Activity Bundle: Teaching PPT, language cards, game
This resource has been put together in order to support the class teacher to introduce, teach and embed the language, knowledge and skills of Probability.There are three elements to this bundle (which can be purchased separately through this store):Powerpoint Lead off teaching session:Comprising of 21 teaching slides, this presentation takes the children on a full journey from the very first introduction of the topic of Probability through to solving complex probability problems. Key skills taug
Subjects:
Grades:
4th - 7th, Staff
Statistics Topic Six - Normal Distribution and Central Limit Theorem
Here's the Sixth Topic in Statistics Powerpoint LectureStatistics Lecture SixIn this Powerpoint topics are Normal Distribution and Central Limit Theorem. It gives a nourishing lecture about Normal distribution, how to convert values to z-score, how to find area and probability under the normal curve when to use Central Limit theorem and the theorem behind it.Each topic is summarized and easy to understand, rather letting your students read the statistics book. This powerpoint is not wordy it giv
Subjects:
Grades:
8th - 12th, Higher Education, Adult Education
All About Data PowerPoint Presentation
Data power point is a 40 page slide show about data or collecting information. The power point explains ways people can collect data. It explains what a survey is and ways to gather information. After conducting the survey, sorting the information into categories can help you learn something about the group. The power point explains ways to show information through a bar graph, line plot or pictograph. It also explains the history of data and how it is the basis for mathematics. Questions
Subjects:
Grades:
1st - 6th
Help with Factorials Combinations and Permutations
In your math (statistics, pre-algebra) class, how many students can really understand the difference between a combination and permutation? My guess is less than half, because that it how it is in my classroom. This lesson, with plenty of practice problems, will definitely help with that understanding rate of less than 50%!!Also included Factorial Worksheets.The format is easy to understand in student-friendly language.Have fun!!
Subjects:
Grades:
8th - 10th
CCSS:
Also included in: Pre-Algebra Curriculum Bundle
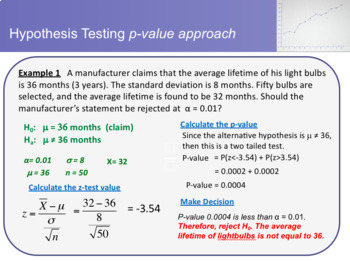
Statistics Topic Nine - Hypothesis Testing with two samples
Here's the Ninth Topic in Statistics Powerpoint LectureIntensive and easy approach in learning hypothesis testing with two samples : 35 slides in all(topics:Large Independent SamplesSmall Independent SamplesDifference between means Dependent SamplesDifference between ProportionsStatistics Lecture NineIn this Powerpoint it discuss how to do Hypothesis Testing with two samples.(2(1) How to decide whether two samples are independent or dependent(2) How to perform a two sample z-test for difference
Subjects:
Grades:
9th - 11th, Higher Education, Adult Education
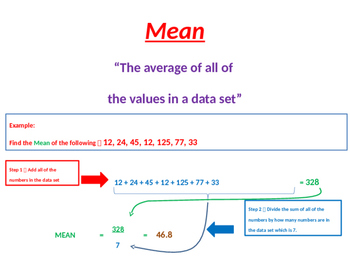
General Statistics - Mean, Median, Mode, Range and Mean Absolute Deviation
I use this MS PowerPoint presentation file to kickoff our study of Statistics in my 7th and 8th grade math classes. It reviews the definitions and detailed methods required to calculate the mean, median, mode, range and mean absolute deviation (MAD) of a data set(s). It is a totally animated ppt file and very easy for students to understand. Any of the ppt animations can be modified as desired by the presenter (teacher). It also includes 2 example problems for the students to complete towar
Subjects:
Grades:
7th - 8th
CCSS:
Math Match-Up: Measures of Center with Decimals
This matching activity practices and reinforces the skills of determining Measures of Center utilizing decimal data pieces. This Match-Up contains two separate challenges. The first challenge activity provides a focus on just the Measure of Center Mean. This challenge requires decimal number computation. Challenge activity two requires the knowledge and differentiation between the Measures of Center to evaluate for Mean, Median, Mode and Range. Decimal calculation is required. Math Match-Up Chal
Subjects:
Grades:
4th - 12th
Types:
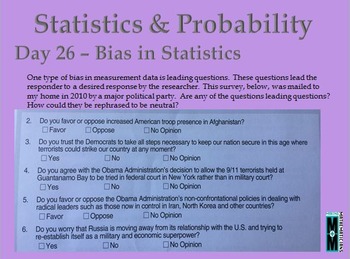
Statistics and Probability Daily Math Slides
These 35 slides focusing on Statistics and Probability are intended to show students the beauty and inter-connectedness of mathematics. These slides can be used as warm-ups or bell ringers or to launch a lesson. Each slide could lead to an extended project or math center. The slides are appropriate for grades 3-12 because they are open-ended or have animation geared to different grade levels. If you purchase all 5 strands of daily math slides you can buy it for a reduced bundled price of $20
Subjects:
Grades:
3rd - 12th
Measures of Central Tendency PowerPoint
Here lies a PowerPoint for a quick review of how to choose the most beneficial measure of central tendency and how to calculate a "wanted" or "missing" piece of data when using mean. This makes a good math center, bellwork, or whole class discussion. Sometimes I use it to pre-test; sometimes for a post-test. ENJOY!
Subjects:
Grades:
7th - 9th
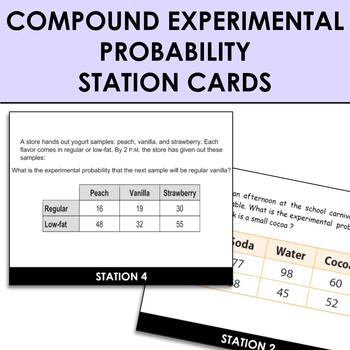
Compound Experimental Probability Station Rotations Practice Cards
Give your students to opportunity to practice finding compound experimental probability. These task cards to hang/place around the room provide the chance for repetitive practice of solving for the compound probability, given the results of an experiment using a table. I recommend using this as a 6-group station rotation, then coming together at the end of your time to discuss the answers as a whole class.
Subjects:
Grades:
6th - 8th
Types:
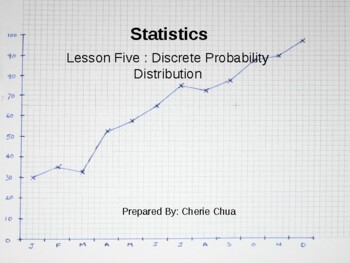
Statistics Topic Five - Discrete Probability Distribution
Here's the Fifth Topic in Statistics Powerpoint LectureStatistics Lecture FiveIn this Powerpoint topic is Discrete Probability Distribution. Topics includes in creating a Probability Distribution, when and how to use Binomial Distribution, Geometric Distribution and Poisson Distribution.Each topic is summarized and easy to understand, rather letting your students read the statistics book. This powerpoint is not wordy it gives enough illustration on how to solve each problem cleary and plenty eno
Subjects:
Grades:
8th - 12th, Higher Education, Adult Education
Theoretical and Experimental Probability
16 questions that are great for practice, 7th grade (Texas) math STAAR review, games, etc. This is a self-checking activity using QR codes. The QR codes not only give correct answers, but also explains how to get the correct answer.
Fun way to practice probability rather than worksheets.
You could have a relay race between teams having them answer the questions and then come to you to check their answer or a specific location to scan the QR code. It could be used to play basket ball. My
Subjects:
Grades:
6th - 8th
Types:
Statistics Topic Ten - Correlation and Regression
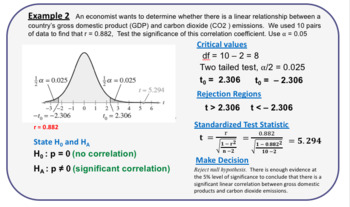
Here's the Tenth Topic in Statistics Powerpoint LectureIntensive and easy approach in learning Correlation and Regression : 30 slides in allCorrelation and RegressionCorrelation CoefficientLinear RegressionStandard Error EstimatePrediction IntervalStatistics Lecture TenAll example problems used includes complete and step by step solution!Each topic is easy to understand, rather letting your students read the statistics book. This powerpoint is not wordy it gives enough illustration on how to sol
Subjects:
Grades:
10th - 12th, Higher Education, Adult Education
Showing 1-24 of 29 results


