22 results
Adult education statistics interactive notebooks for Gifted and Talented
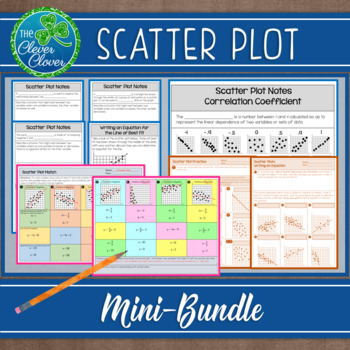
Scatter Plot Mini-Bundle
This resource includes six half pages of notes that are perfect for interactive notebooks. The first three pages introduce students to positive, negative and no correlation scatter plots. Students are asked to describe real world situations that might exist for each type of correlation. Students will graph three different sets of data in order to visualize the different types of scatterplots. Definitions for the line of best fit and correlation coefficient are provided. Each one of the half p
Subjects:
Grades:
6th - 9th, Adult Education
CCSS:
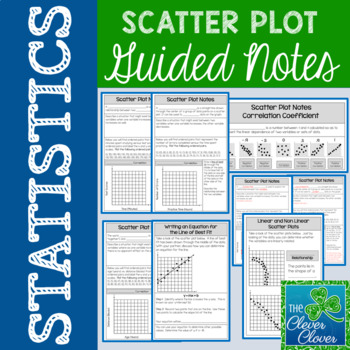
Scatter Plot Notes
This resource includes six half pages of notes that are perfect for interactive notebooks. The first three pages introduce students to positive, negative or no correlation scatter plots. Students are asked to describe real world situations that might exist for each type of correlation. Students will graph three different sets of data in order to visualize the different types of scatterplots. Definitions for the line of best fit and correlation coefficient are provided. Each one of the half pa
Subjects:
Grades:
6th - 9th, Adult Education
Types:
CCSS:
Also included in: Scatter Plot Mini-Bundle

Normal Distribution Foldable Popup
This is a popup of a normal distribution graph, showing students the probable spread of data within 1, 2, 3, and 4 standard deviations of the mean. The formulas for the population standard deviation and the sample standard deviation are both included. It is a great reference/graphic organizer for student notebooks and I have even had students who weren't in my class ask to join because they wanted this popup too. Useful for math or maths class, great for visual and kinesthetic learners, and
Subjects:
Grades:
9th - 12th, Higher Education, Adult Education
CCSS:
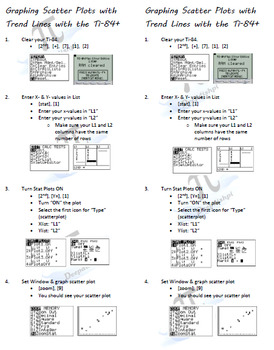
Scatterplots & Linear Regression (Trend Line) on Ti-84 (student notes)
This is a simple step-by-step list for student interactive notebooks.
Steps walk students through entering data, graphing the scatterplot and linear regression (tend line) in the Ti-83/84 family of graphing calculators. Screen shots of what the students see on their Ti are also included to encourage autonomy after initial instruction.
It is ready to be copied as a double-sided page and cut in half (long-wise), saving you precious paper! I hope you find this resource helpful!
TEKS
8.11(A)
Subjects:
Grades:
8th - 12th, Higher Education, Adult Education
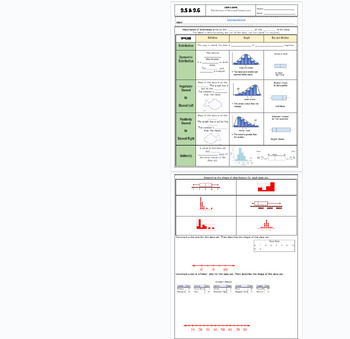
Data Distribution positive/negative skewed fillable notes UPDATED
Unit 9: Data and Stats: Updated(No 9.3/ Skip)9.5/9.6 Data Distribution (skewness)Students go over the vocabulary and complete the examples with the vocabulary scaffolded. Skewness is explained and how to identify it comparing data charts and box and whisker plots. Uses many visuals and examples to differentiate between that different graphs. Notes are scaffolded. Includes hook video hyperlinked on the "learning objective" title. Key is included and hyperlinked as a PDF in the heading highlighted
Subjects:
Grades:
6th - 12th, Higher Education, Adult Education
CCSS:
Also included in: Unit 9: Data and Statistics Fillable Notes
Standard Deviation Fillable Notes UPDATED
Unit 9: Data and Stats: Updated(No 9.3/ Skip)9.4 B Standard DeviationStudents go over the vocabulary and complete the examples with the vocabulary scaffolded. Standard deviation is long hand calculated by showing each step of the process (difference of squares). Real-world examples are explained in notes before calculating to show the importance of this stat and why it is used so often to verify valuable and effective data. Notes are scaffolded. Includes hook video hyperlinked on the "learning o
Subjects:
Grades:
7th - 12th, Higher Education, Adult Education
CCSS:
Also included in: Unit 9: Data and Statistics Fillable Notes

7 Go-to Strategies to Tame Stress
7 Go-to Strategies to Tame Stress
Grades:
8th - 12th, Higher Education, Adult Education, Staff
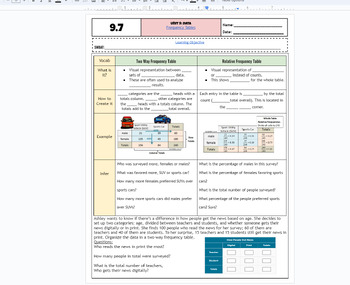
Frequency Tables & Relative Frequency Tables fillable notes UPDATED
Unit 9: Data and Stats: Updated(No 9.3/ Skip)9.7 Frequency Tables Students go over the vocabulary and complete the examples with the vocabulary scaffolded. Students examine a categorical table/frequency table and also use that information to create relative frequency tables. Different real-world examples and problems are used. Emphasized how percents and decimals are calculated. Notes are scaffolded. Includes hook video hyperlinked on the "learning objective" title. Key is included and hyperli
Subjects:
Grades:
6th - 12th, Higher Education, Adult Education
CCSS:
Also included in: Unit 9: Data and Statistics Fillable Notes
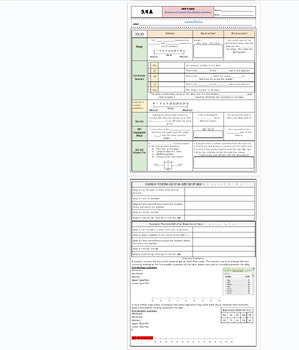
5 Number Summary and Box and Whisker Plots Fillable Notes UPDATED
Unit 9: Data and Stats: Updated(No 9.3/ Skip)9.4 A 5-number summary and box and whisker plot Students go over the vocabulary ad complete the examples with the vocabulary scaffolded. for each statistic with an explanation of the purpose of the 5 number summary and why these are used. Notes are scaffolded. Includes hook video hyperlinked on the "learning objective" title. Key is included and hyperlinked as a PDF in the heading highlighted in the orange box, and at the bottom of the google doc as w
Subjects:
Grades:
6th - 12th, Higher Education, Adult Education
CCSS:
Also included in: Unit 9: Data and Statistics Fillable Notes
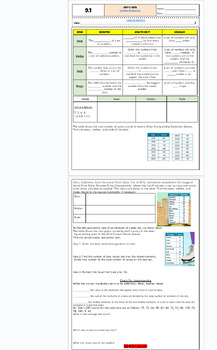
Central Tendencies: Mean, Median and Mode fillable notes: Updated
Unit 9: Data and Stats Updated9.1 Central Tendencies: mean median and modeStudents go over the vocabulary and how to find each average with examples. Notes are scaffolded. Includes hook video hyperlinked on the "learning objective" title. Key is included and hyperlinked as a PDF in the heading highlighted in the orange box, and at the bottom of the google doc as well. Google doc is editable, used in M1 HS
Subjects:
Grades:
6th - 12th, Higher Education, Adult Education
CCSS:
Also included in: Unit 9: Data and Statistics Fillable Notes

Digital Notebook with Cornell Note Pages
VIDEO DESCRIPTION This 100-page digital notebook has links from the Table of Contents to each slide in the deck. You may send a copy to each student and they will never lose their notebook again! Students can import pictures, graphs, and diagrams, etc. to the left-hand pages and write their notes with question and summary on the right-hand page. Each page has text boxes for each section, for easy organization of their notes. All pages are numbered. There are extra Table of Content pages a
Grades:
6th - 12th, Higher Education, Adult Education
Types:

Statistics
Powerpoint covering;-Statistical terms-Bias-Data skews-Standard deviation-Z-scores-Standard scores
Subjects:
Grades:
9th - 12th, Higher Education, Adult Education, Staff

ENGLISH IDIOMS CRYPTOGRAM PUZZLE BOOK 300
Unleash your inner codebreaker and dive into the captivating world of idioms! This unique and engaging book combines the intrigue of cryptograms with the richness of American English idiomatic expressions.Get ready to decipher and decode over 300 carefully curated common idioms, each transformed into captivating and brain-teasing cryptograms. Challenge yourself and embark on a linguistic adventure as you unravel the hidden meanings behind these well-known phrases.Designed for puzzle enthusiasts,
Subjects:
Grades:
7th - 12th, Higher Education, Adult Education
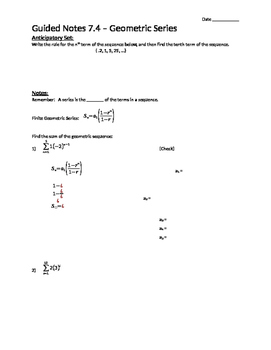
Geometric Series - Notes
Guided notes teaching students how to find the sum of finite and infinite geometric series written in sigma form as well as just in series form. The notes end with a real-world word problem. I also have a corresponding assignment of the same name.
Subjects:
Grades:
9th - 12th, Higher Education, Adult Education
Types:
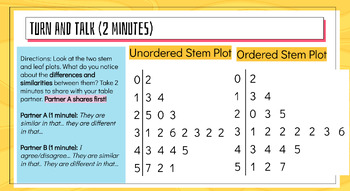
Lesson 1 PowerPoint: One Variable Data for Statistics: Dot Plots, Histograms,etc
This is a lesson (on powerpoint) about statistical distributions. The lesson includes practice problems and vocabulary relating to dot plots, stem plots, and describing/comparing statistical distributions. This is for secondary math (high schoolers). It includes some data collection activities and requires students to get involved in the lesson. If you teach with a tablet, iPad, or smart board, this template is writing-friendly. You can write on the presentation or edit it as you need for your c
Subjects:
Grades:
9th - 12th, Adult Education
Types:
CCSS:

أجندتى Planner
معا لتنظيم الوقت والمهام الكثيرة لإنجاز الأعمال و سرعة الوصول إلى الخطط الشهرية والأسبوعية واليوميةهنا ستجدون جدول مهام صمم بإبداع واحترافيةولأن اللحظات السعيدة تستحق الاحتفاء نشارككم فيها بكل حب.
Grades:
4th - 12th, Higher Education, Adult Education, Staff
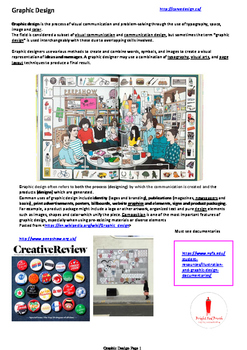
Graphic Design introduction by BRB
This is an interactive teaching resource designed to be projected onto a white board/ smart board etc. It is specially designed for senior students, year 10, 11, 12 (aged 15-18). It is a simple, easy to understand introduction into Graphic Design principles looking specifically at tools, techniques and specific graphic artists.Each page has potential to go into much more detail if you click on the links as you choose appropriate.
Subjects:
Grades:
7th - 12th, Higher Education, Adult Education
Digital Notebook
VIDEO DESCRIPTION This 100 page digital notebook can be used by middle school and high school students and adults as well. It includes a table of contents that can be linked to its correct slide. All text boxes are ready to go and instructions for students to link their pages. It's very easy! Extra Table of Content pages are included at the end of the slide deck. All pages are numbered.**See also my Digital Notebook with Cornell Note Pages.(I am open to any personal alterations you would li
Grades:
6th - 12th, Higher Education, Adult Education
Types:
Geometric Sequences - Notes
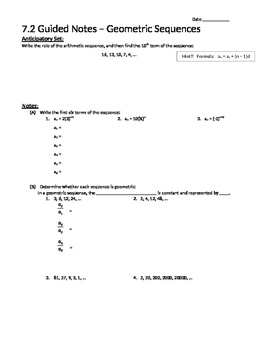
Guided notes teaching students how to write terms of a given sequence, determine if a sequence is geometric (and find the common ratio), write the rule for the nth term, and find a requested term when given a rule or a sequence. This also includes a review of arithmetic sequences from my previous notes (Arithmetic Sequences), as well as a real-life word problem. I also have a corresponding assignment of the same name.
Subjects:
Grades:
9th - 12th, Higher Education, Adult Education
Types:
Normal Distribution Graphic Organizer
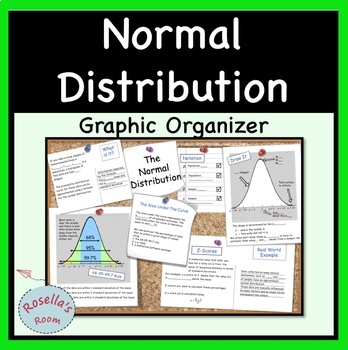
This graphic organizer summarizes:- properties of the normal distribution- the 68-95-99.7 rule- z-scoresIncluded are three scaffolded versions of the same graphic organizer; two are designed for students to fill in (one is left blank and the other has missing text) and the third is complete with all text. Great for revision.
Subjects:
Grades:
9th - 12th, Higher Education, Adult Education
Arithmetic Sequences - Notes
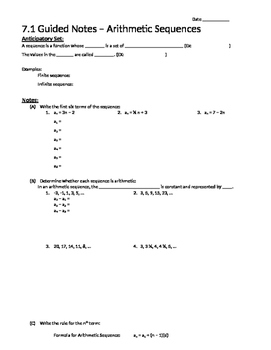
Guided notes teaching students how to write terms of a given sequence, determine if a sequence is arithmetic (and find the common difference), write the rule for the nth term, and find a requested term when given a rule or a sequence. I also have a corresponding assignment of the same name.
Subjects:
Grades:
9th - 12th, Higher Education, Adult Education
Types:
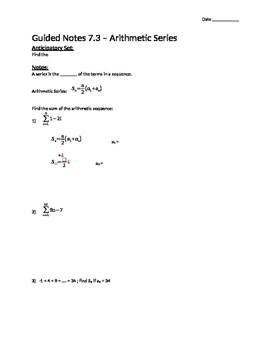
Arithmetic Series - Notes
Guided notes teaching students how to find the sum of arithmetic series written in sigma form as well as just in series form. The notes include two real-world word problems. I also have a corresponding assignment of the same name.
Subjects:
Grades:
9th - 12th, Higher Education, Adult Education
Types:
Showing 1-22 of 22 results

