91 results
8th grade statistics printables $5-10
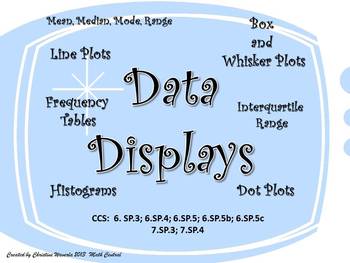
Data Displays: Line Plots, Histograms, Box and Whisker Plots, Frequency Tables
This is one of my favorite teaching tools! I created this Data Display set of worksheets this year for my 6th grade class. My students loved using these worksheets to practice their new skills. Each worksheet provides plenty of room for students to create their data displays and answer questions based on the data. Questions ask students to find the mean, median, mode, range, interquartile range, and percentages.These worksheets are fully aligned with the Common Core Curriculum.CCS: 6.SP.3; 6.SP
Subjects:
Grades:
6th - 8th
Types:

Standard Deviation Activity: Escape Room Algebra Breakout Game (Statistics Unit)
This breakout escape room is a fun way for students to test their skills with calculating standard deviation. Contents: ♦ Teacher Instructions and FAQ ♦ 3 Levels to decode: Multiple Choice, Tarsia Puzzle, and Maze ♦ Student Recording Sheet and Teacher Answer Key ♦ Link to an optional, but recommended, digital breakout roomCheck out the preview and the video preview for more details! - The video preview will show the correct puzzles for this escape
Subjects:
Grades:
8th - 12th
Types:
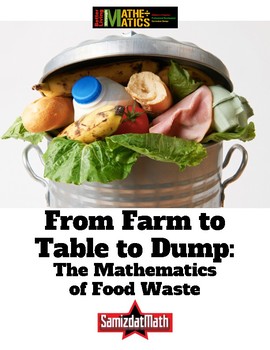
Food Waste and Mathematics: From Farm to Table to Dump
Here's a very uncomfortable fact: it takes 4 pounds of potatoes to make 1 pound of potato chips. That means that for every 1 pound bag of potato chips you eat, 3 pounds of potatoes have to be thrown away. What a waste of food! This is a series of activities that looks at the hidden world of food waste. It includes a look at how much food is wasted as it is "processed" into finished products like french fries and potato chips. It also includes mathematical activities where students calculate how
Subjects:
Grades:
5th - 12th, Adult Education
Types:
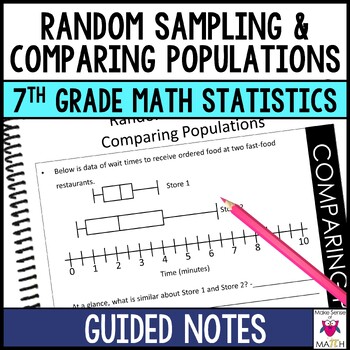
7th Grade Math Statistics Notes Random Sampling and Comparing Populations
Students writing sloppy notes? Improve their engagement and understanding of random sampling and comparing populations. These 7th grade statistics notes focus on how to effectively obtain a random sample from a population and comparing measures of center and measures of variability with two data sets. The data sets are displayed as dot plots and box plots. Also includes vocabulary charts for easy reference. Students will calculate, explain, analyze, and delve into statistics. Save a BUNDLE by p
Subjects:
Grades:
7th - 8th
Also included in: 7th Grade Math Curriculum and Activities Bundle CCSS
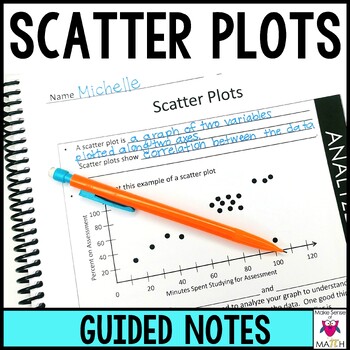
Scatter Plots Guided Notes - Scatter Plots and Line of Best Fit Notes
Save some time with these scatter plots guided notes that dive into correlations, linear associations, outliers, clusters, lines of best fit, and construction of scatter plots. These are perfect for 8th grade math or Algebra class. Your students will have a great undrstanding of scatter plots after going through these notes. IF YOU LIKE THESE NOTES THEN CHECK OUT ALL 8TH GRADE NOTES HERE!These in-depth guided notes contain:1 title page14 pages of guided notesCONTAINS 2 FORMATS: ONE WITH A BLACK
Subjects:
Grades:
8th - 9th
Also included in: 8th Grade Math Curriculum and Activities Bundle CCSS

Stem and Leaf Plot Bundle
With three products in one, this bundle will give your kiddos lots of practice with stem and leaf plot, as well as mean, median, mode, and range! All answer keys have ALL WORK SHOWN!!!Included:Resource 1 (7 pgs): cover teacher notesstudent notesstudent printablemodified version!!answer keycredits Resource 2 (5 pgs): cover student printable incorporating stem and leaf plot with mean/median/mode/rangemodified version!!answer keycreditsResource 3 (10 pgs): coveractivity booklet...A great challenge
Subjects:
Grades:
5th - 8th
Types:
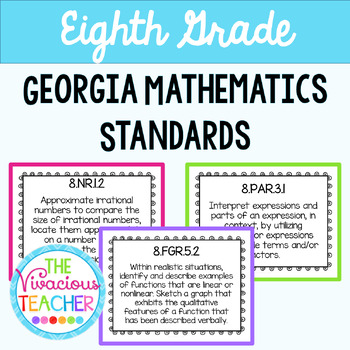
Georgia Mathematics Standards Posters for Eighth Grade
This pdf file includes Georgia Mathematics Standards posters for Eighth Grade. They have been updated for the 2023-2024 school year. These posters were designed in black and white so you can save your color ink! I print these posters on colored card stock and laminate so they are ready to hang in my classroom year after year.Standards included:Mathematical Practices and ModelingNumerical ReasoningPatterning and Algebraic ReasoningFunctional and Graphical ReasoningGeometric and Spatial Reasoning♥
Subjects:
Grades:
8th
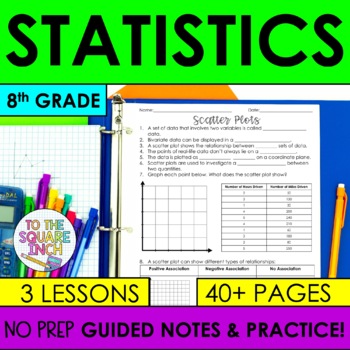
Statistics - 8th Grade Math Guided Notes and Practice | Plots | Lines of Fit
Looking for 8th grade guided notes for Statistics that are designed to help your students thrive and save you the time and energy of writing and designing them yourself? These NO PREP guided notes are a classroom-proven resource that will have your students proficient in entire 8th Grade Math statistics common core standards. With a comprehensive design, these notes offer a structured approach that can be differentiated for every level of learner for the entire unit. Save 20% when you purchase
Subjects:
Grades:
7th - 9th
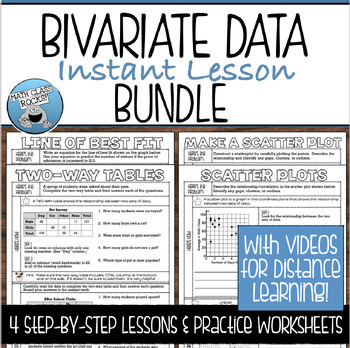
BIVARIATE DATA GUIDED NOTES AND PRACTICE BUNDLE
Save time and make your life easy with this set of BIVARIATE DATA GUIDED NOTES and PRACTICE WORKSHEETS! Perfect for introducing a new concept, reviewing a previously learned skill, or your interactive notebook! These guided notes will simplify every lesson with step-by-step examples and practice problems to provide a year-long resource for your students to refer to again and again!This lesson is included in my Linear Equations Instant Lesson BUNDLE. Click HERE to view this resource and SAVE 25%!
Subjects:
Grades:
7th - 9th

Graphs with Mean Median Mode and Range Bundle
What resources are included in this bundle?Dot Plots (notes + four worksheets with mean, median, mode, and range)Stem and Leaf Plots (matching plots to mean, median, mode, and range statements)Line Plots (four half-page exercises using mean, median, and mode...NO range)See individual products for full descriptions!How will my students benefit from these resources?Your students will enjoy practicing measures of central tendency through the context of a bakery, doggy day care, lifeguarding, and ot
Subjects:
Grades:
5th - 8th
Types:
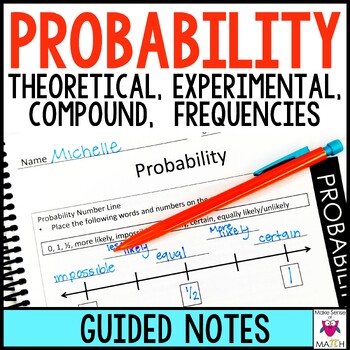
Probability Guided Notes 7th Grade Math
Grab these Probability notes for 7th Grade Math. These are thorough and quality probability notes aligned to common core standards. These probability notes focus on probability vocabulary, calculating probability, theoretical probability vs. experimental probability, frequencies and compound events. Formatted for back-to-back printing with page numbers. Teacher can create a packet for student organization. These in-depth guided notes contain:1 title page5 pages of guided notesCONTAINS 2 FORMATS
Subjects:
Grades:
7th - 8th
Also included in: 7th Grade Math Curriculum and Activities Bundle CCSS
Super Bowl Math - 2024 Edition
UPDATED for 2024!New - Bundle includes original Superbowl Math templates and Superbowl Math Cheat Sheets / Quick Version. Also new, Superbowl Timeline template.Target Grade Levels: 4-8 gradeTired of the same old data probability activities involving flipping coins and rolling a number cube?Try using a real-life application using a subject that get students, especially boys, interested in math!Have your students use real-life data/ stats to make a prediction about the Super Bowl winner!Students
Subjects:
Grades:
4th - 8th
Types:
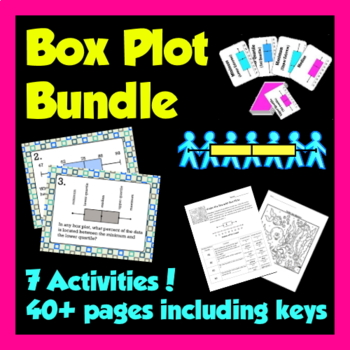
Box Plot Bundle - 7 activities! 51 pages and keys
Box Plots (or box and whisker plots) are easy to teach, if your students are engaged with the material. You just need the right materials! That's why I've put these 6 popular items all together in one bundle. They have over 60 positive feedback comments among them, so you can buy with confidence! Plus, you save over 50% by grabbing them all in one bundle.Please click on the individual links for a closer look at each item:Box Plot Basics - notes and key for introducing students to box plots,
Subjects:
Grades:
6th - 9th
Types:
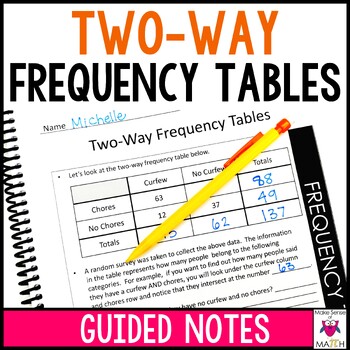
Two-Way Frequency Tables Notes
Save some time with these two-way frequency tables guided notes that delve into creating frequency tables and relative frequency tables based on rows and columns. As well as interpreting relative frequency tables for associations between bivariate categorical data.These in-depth guided notes contain:1 title page9 pages of guided notesCONTAINS 2 FORMATS: ONE WITH A BLACK STRIP AND AN INK SAVING WHITE STRIP2 pages of additional practice (10 problems)1 lined page for extra notesTeacher Tips PageCom
Subjects:
Grades:
8th - 9th
CCSS:
Also included in: 8th Grade Math Curriculum and Activities Bundle CCSS
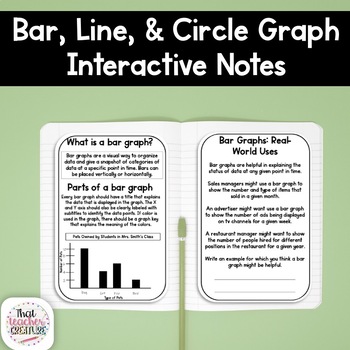
Bar, Line, and Circle Graph Interactive Notes
Make teaching bar, line, and circle graphs easier with these interactive notes! This no-prep set includes 3 sets of interactive notes perfect for exploring types of graphs. Quick and easy setup helps save you time and provides students with notes they need to understand the purpose, parts, and real-world uses of each type of graph. Here's what you'll get:purpose of a bar, line, and circle graphparts of a bar, line and circle graphreal world application of each type of graphguided practice - crea
Subjects:
Grades:
4th - 12th
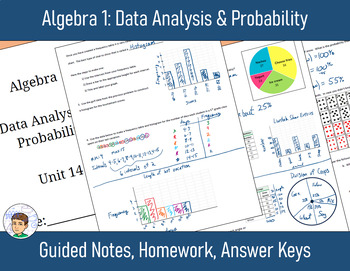
Algebra 1 Unit 14: Data Analysis & Probability - Notes, Homework, Answers
This unit is a great resource for any math course looking to add a supplementary unit on Data Analysis and Probability. You are buying guided notes, notes keys, homework assignments, and answers for a 6 lesson unit. This unit is based on a traditional Algebra 1 curriculum.Please check out the preview file to see what the unit will look like.This Word document makes it easy for you to modify, edit, or copy and paste to make your own reviews and tests for the unit.Topics covered in this unit are:R
Subjects:
Grades:
7th - 10th
Types:
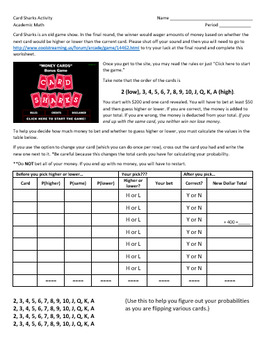
Card Sharks Probability Activity
A fun way to have students practice probability by calculating as they play the Fast Money Round of the old game show, Card Sharks.
The students will go onto the provided website where they will use probability to help them decide if the net card will be higher or lower than the previous one. Upon completing the game, there are questions to help them analyze the probability involved in the game.
Two versions are included (for two different websites). There is word documents to print the worksh
Subjects:
Grades:
7th - 12th
Types:
CCSS:
Grade 8 Common Core Math Worksheets: Statistics and Probability 8.SP 1-4
Common Core State Standards - Grade 8 Mathematics
These 12 worksheets contain math problems aligned with the 8th grade common core state standards (CCSS) listed below.
[SP Statistics and Probability]
Investigate patterns of association in bivariate data.
1. Construct and interpret scatter plots for bivariate measurement data to investigate patterns of association between two quantities. Describe patterns such as clustering, outliers, positive or negative association, linear association, and
Subjects:
Grades:
8th
Types:

Analyzing Graphs Booklet- Stem & Leaf, Dot Plot, Box & Whisker, and Histogram
The download allows students to explore the following graphs: Stem & Leaf Plots, Dot Plots, Box and Whisker Plots, and Histograms. Each graph in the booklet contains the following sections: fill in the blank definition, example graph, graph to create on their own from given data, and analyzing questions from their graphs.
Note- When printing the booklets, I have found that you need to print "flip on short edge" in order for the pages to align properly.
Please follow me and rate your purch
Subjects:
Grades:
5th - 8th
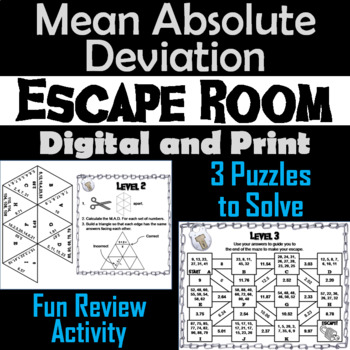
Mean Absolute Deviation Activity: Algebra Escape Room Math Game (Statistics)
This breakout escape room is a fun way for students to test their skills with calculating mean absolute deviation. Contents: ♦ Teacher Instructions and FAQ ♦ 3 Levels to decode: Multiple Choice, Tarsia Puzzle, and Maze ♦ Student Recording Sheet and Teacher Answer Key ♦ Link to an optional, but recommended, digital breakout roomCheck out the preview and the video preview for more details! - The video preview will show the correct puzzles for this es
Subjects:
Grades:
6th - 9th
Types:
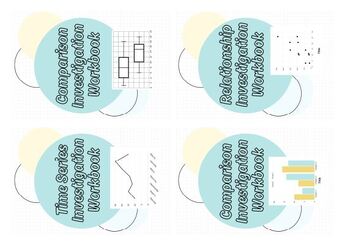
PPDAC Investigation Booklets
A bundle of four booklets focusing on learning how to use the PPDAC cycle for different investigation types. The bundle includes the following booklets:Dual Comparison InvestigationTime Series InvestigationRelationship InvestigationBox and Whisker Comparison Investigation
Subjects:
Grades:
6th - 10th
Types:
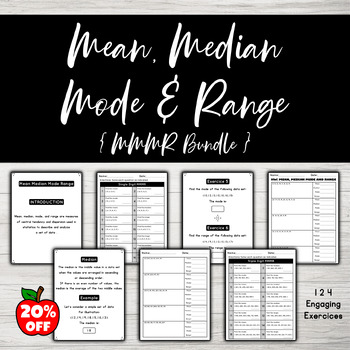
Mean Median Mode Range Activity MMMR Bundle (Measures of Central Tendency)
This bundle includes three distinct activities focusing on mean, median, mode, and range! By purchasing this bundle, you'll enjoy a cost-saving of over 20% compared to acquiring each activity separately.Take a moment to explore the detailed product descriptions and previews to ensure that these activities align with the needs of your classroom.Unlock the power of interactive learning with MMMR Activity Worksheets - because mastering math has never been this enjoyable!Happy Teaching :)★ Thank you
Subjects:
Grades:
4th - 8th
Types:
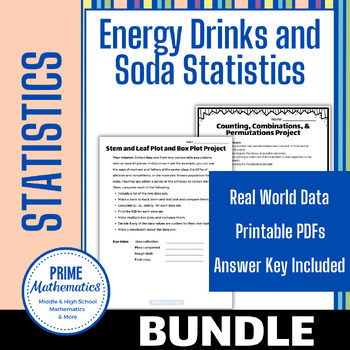
Energy Drinks and Sodas Statistics Bundle
Use statistics about energy drinks and sodas (sugar and caffeine content) to practice finding measures of central tendency and variability and creating charts such as box-and-whisker plots, dot plots, and histograms. The students will compare the amount of sugar and caffeine in energy drinks and sodas.The following topics are covered:Mean, Median, & ModeFive-number summaryIQR & RangeBox plots (with or without checking for outliers)Mean absolute deviationStandard deviationHistogramDot Plo
Subjects:
Grades:
6th - 12th
Types:
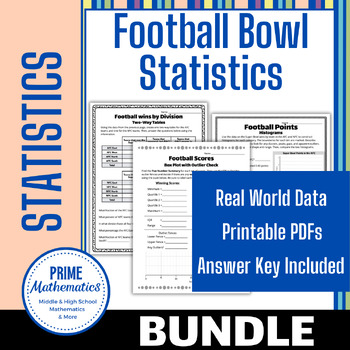
Football Bowl Statistics Super Bundle
Use statistics from previous football championships to practice finding measures of central tendency and variability and creating charts such as box-and-whisker plots, dot plots, and histograms. The students will look at football championship wins and scores. This is a super way to engage sports fans in math.The following topics are covered:Mean, Median, & ModeFive-number summaryIQR & RangeBox plots (with or without checking for outliers)Mean absolute deviationStandard deviationHistogram
Subjects:
Grades:
6th - 12th
Types:
Showing 1-24 of 91 results


