11 results
8th grade statistics resources for Microsoft Excel $5-10
12 Days of Christmas: A Computer Spreadsheet Activity
This great holiday activity shows students how to use a computer spreadsheet to calculate the cost of their true love's gifts in today's dollars.The simple step-by-step procedure will allow both beginning and computer-savvy students to experience success as they learn how to use spreadsheet software. Students will enjoy the engaging and entertaining activity. No computer? No problem! Use the activity master so students can calculate the costs themselves.
Grades:
5th - 9th
Types:
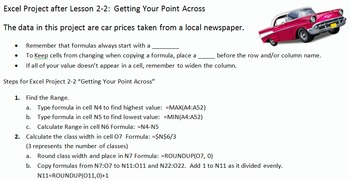
Excel Projects for Statistics Frequency Distributions and Charts
This file contains three different projects with solutions and a quick reference card for students. It correlates to Bluman's Elementary Statistics textbook.
First is an Introduction to Excel. There is an example, guided practice and then 4 Projects. The instructions are on each sheet. The topics covered are: basic editing and formatting, beginning charts, beginning formulas, such as SUM and AVERAGE, and calculations. There is an editable grading rubric for this project. The Preview file
Subjects:
Grades:
8th - 11th, Higher Education, Adult Education
Types:
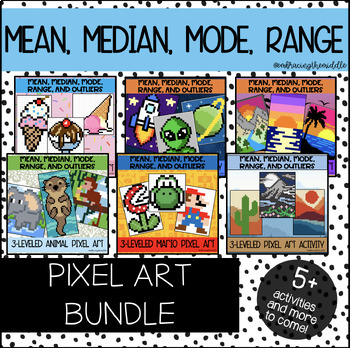
Mean, Median, Mode, and Range Pixel Art BUNDLE for Middle Schoolers | Math
This growing bundle will provide you with 6 pixel art activities that can help deepen student understanding of mean, median, mode, range, and outliers. These pixel art activities have three different levels of knowledge. Gives teachers more flexibility to support individual student needs. This resource can be used in the classroom as a formative assessment, independent classwork, homework, or much more! Students will solve 10 mean, median, mode, and range problems to reveal a mystery image. Give
Subjects:
Grades:
6th - 8th
Types:
Presidential Data Analyst Math Project | Excel | Presentations | Presidents Day
Elevate your Presidents' Day lesson plans with this comprehensive Presidential Data Analysis Math Project, designed to engage students in a deep exploration of U.S. presidential history through mathematical analysis. This invaluable resource provides educators with everything they need to guide their students through a dynamic and informative project that combines historical research with mathematical concepts.**Key Features:**1. **Thematic Relevance:** - Aligned with Presidents' Day, this o
Subjects:
Grades:
7th - 10th
Graphs, Charts, and Tables: U.S. Census Data Study
This lesson uses data from the 2010 U.S. Census to allow students to access numbers and data in a social science classroom. The lesson is a 2 day mini-unit centered on working with charts, graphs, and tables (serves extremely well for SAT and ACT prep). This cross-curricular lesson draws meaningful parallels between math and social science, and the necessity of bringing these subjects together. The lesson uses a comparative look at Census data for California and the United States as a whole, but
Subjects:
Grades:
8th - 12th, Higher Education
Types:
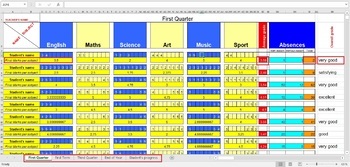
Calculate Student's Final Marks ( Grades ) in excel
If you want to easily calculate student's marks this excel document is great solution. I added all excel's necesarily formulas to make this important task so easier.When you add the marks for every subject, it's final mark will be automatically calculated. At the same time average grade will also be calculated and updated.There is also section for absences (excused and unexcused) which will also be calculated.At the end, if student's Overall grade is equal or above 4.5, it will be automaticaly w
Subjects:
Grades:
PreK - 12th, Higher Education, Adult Education, Staff
Types:

Homeostasis Heart Rate Lab
This lab can be used for middle school sciences, any Biology-based science class, or mathematics statistics classes. Included are a word document with instructions, lab, an excel spreadsheet with example data, a blank sheet with formulas that will calculate data, and a PowerPoint with student instructions.
Subjects:
Grades:
6th - 12th, Higher Education
Types:

Editable School Building Energy Saving Form
Do you have Watt Watchers or an energy savers club at your school? Need a quick and efficient way to track teachers wasting energy in their rooms? This form is divided by grade level, then by teacher. All you need to do is edit teacher names and student names and tracking the whole school will be a breeze!!
Subjects:
Grades:
3rd - 12th, Staff
Reasoning and Problem Solving in Math - A Student Workbook
This is a student-centered workbook that reviews students’ application of concepts in mathematics such as:PercentagesRepresenting data as bar charts or pie chartsWorking out combinations of two or three itemsUsing area and perimeterUse models to solve problemsFractionsThe main concept addressed in this workbook is Combinatorics. Students are encouraged to find combinations using some sort of reasoning using mathematical models without being introduced to the algorithm or calculators. This is bel
Subjects:
Grades:
6th - 8th
Types:
mean, median, mode, and range Unit
Multiple classroom activities working towards finding the mean, median, mode, and ranges. Offers short projects, as well as, long range projects.
Subjects:
Grades:
4th - 8th

Stock Market Simulation
This product has a full lesson on how to teach students about the stock market. This allows them to actively work with different stocks to find out how stocks can shift and change over time. It can be adapted as a 9 weeks, semester, or even full year project.Included is an introductory PowerPoint, a sample Excel spreadsheet, a handout of the project instructions and a list of tips that I've learned using this that will help you out. This project was originally designed with an Economics class in
Subjects:
Grades:
6th - 12th, Higher Education, Adult Education
Showing 1-11 of 11 results


