31 results
6th grade Common Core 7.SP.B.4 interactive whiteboards
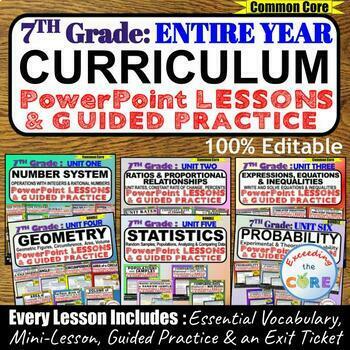
7th GRADE MATH CURRICULUM PowerPoint Lessons DIGITAL BUNDLE (Entire Year)
Get your students to successfully understand the 7th Grade MATH CURRICULUM (all units) with this PowerPoint Presentation BUNDLE.This bundle includes 38 PowerPoint Lessons that are designed to teach the ENTIRE 7th Grade Math Curriculum. Each lesson starts with a mini-lesson and guided practice questions. Every lesson concludes with a lesson quiz and exit ticket to assess student understanding. All of the PowerPoint presentations are 100% editable, therefore you can modify any slide as needed.Thi
Subjects:
Grades:
6th - 8th
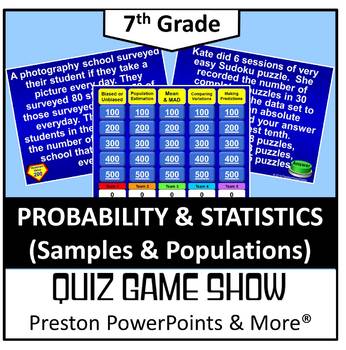
(7th) Quiz Show Game Probability (Samples and Populations) in a PowerPoint
7th Grade Math Quiz Show Game Probability (Samples and Populations) in a PowerPoint PresentationThis Quiz Show game, Jeopardy Style, is a great way to review a chapter. There are 25 questions and a scoreboard so you don’t have to write the score on a side board. Each page has the point value!This Quiz Show game covers all of the following:Experimental and Theoretical Probability 7.SP.6Samples and Populations 7.SP.1, 7.SP.2Comparing Populations with (MAD) 7.SP.3, 7.SP.4NEW: The lesson is in an e
Grades:
6th - 8th
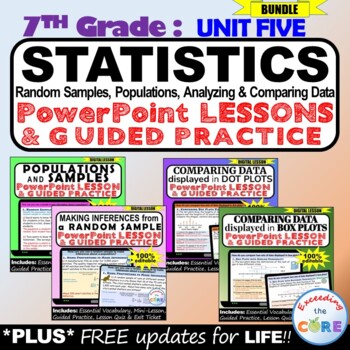
STATISTICS: 7th Grade PowerPoint Lessons DIGITAL BUNDLE
- Great for online learning and distance learning!Get your students to successfully understand the 7th Grade STATISTICS UNIT (random samples and populations, making inferences, analyzing and comparing data ) with this PowerPoint Presentation BUNDLE.This bundle includes 4 PowerPoint Lessons that are designed to teach students how to use samples to gain information about a population. Students will also be able to compare and analyze data in dot plots and box plots.These lessons cover the entire
Subjects:
Grades:
6th - 8th
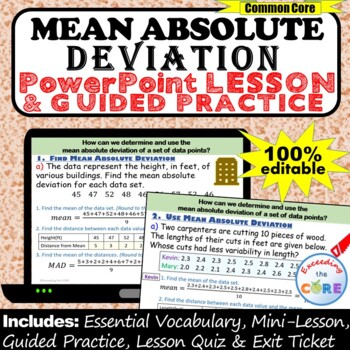
MEAN ABSOLUTE DEVIATION (MAD) PowerPoint Lesson & Practice | Distance Learning
Great for online learning and distance learning!Get your students successfully finding the MEAN ABSOLUTE DEVIATION (MAD) with this PowerPoint Presentation. This lesson begins with a focused mini-lesson and guided practice questions. It concludes with a lesson quiz and exit ticket to assess student understanding. All of the answers are included. This PowerPoint presentation is 100% editable, therefore you can modify any slide as needed.What is Included:_ Mini-Lesson with Guided PracticeThe mini-
Subjects:
Grades:
5th - 7th
(7th) Probability and Statistics {Bundle} in a PowerPoint Presentation
7th Grade Math Probability and Statistics {Bundle} in a PowerPoint PresentationThis is a bundle include the seven PowerPoint lessons below and two Quiz Show games, Jeopardy Style, for review.Outcomes and Events 7.SP.5Probability 7.SP.5, 7.SP.7aExperimental and Theoretical Probability 7.SP.5, 7.SP.6, 7.SP.7a, 7.SP.7bCompound Events 7.SP.8a, 7.SP.8b Probability of Independent and Dependent Events 7.SP.8a, 7.SP.8b, 7.SP.8cQuiz Show Game Probability and Statistics 7.SP.5, 7.SP.6, 7.SP.7a, 7.SP.7b, 7
Grades:
6th - 8th
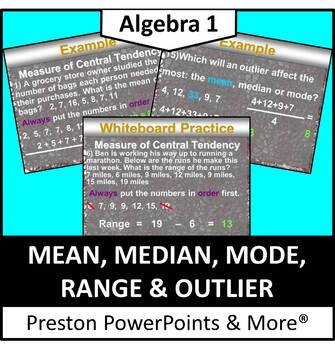
Mean, Median, Mode, Range and Outlier in a PowerPoint Presentation
Mean, Median, Mode, Range and Outlier in a PowerPoint PresentationThis slideshow lesson is very animated with a flow-through technique. It was made for my Algebra 1 class, but can be used for lower grades aw well. The lesson teaches how to solve for mean, median, mode and range. It also teaches to identify outliers in a set of data and find the measure of central tendency.NEW: The lesson is in an editable format so you can tailor the lesson to your class. The problems and clipart can’t be edit
Subjects:
Grades:
6th - 10th
Tree Diagrams and the Fundamental Counting Principle Smartboard Lesson
Teachers ~ You'll LOVE this! One of my best-selling Smartboard Lessons, that has 23 slides total. Great graphics and everything you'll need to teach Tree Diagrams and the Fundamental Counting Principle. Lots of interactive practice with students coming to Smartboard to solve problems too. You're students will love learning from these Smartboard Slides. WARNING: You MUST have SMART Technologies SMART software, and a SMARTBOARD to teach from, to effectively download, open and use this Interactive
Subjects:
Grades:
4th - 7th
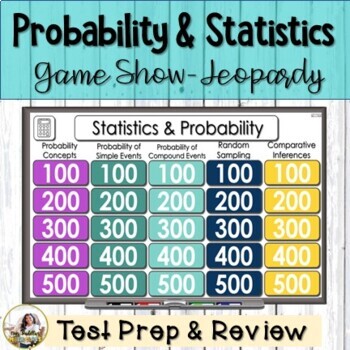
7th Grade Review Game | Probability and Statistics Test Prep
This fun, interactive and engaging 7th Grade probability and statistics Review game will have your students asking for more! Perfect for end of the unit or end of the year review. It can be use as a Jeopardy review game as a whole group, small group activity, or virtual learning. This NO PREP game is the PERFECT end of the unit on probability and stiatistics. Your students will have the chance to practice exercises on a fun and engaging way while competing with other classmates. Don’t worry abou
Subjects:
Grades:
6th - 9th
Also included in: 7th Grade Review Games | Jeopardy Game | 7th Grade Practice
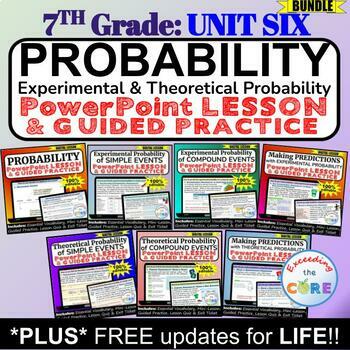
PROBABILITY: 7th Grade PowerPoint Lessons DIGITAL BUNDLE
Get your students to successfully understand the 7th Grade PROBABILITY Unit (experimental and theoretical probability) with this PowerPoint Presentation BUNDLE.This bundle includes 7 PowerPoint Lessons that are designed to teach students how to describe the likelihood of simple and compound events. Students will also be able to make predictions with experimental and theoretical probability.These lessons cover the entire PROBABILITY unit. Each lesson starts with a mini-lesson and guided practice
Subjects:
Grades:
6th - 8th
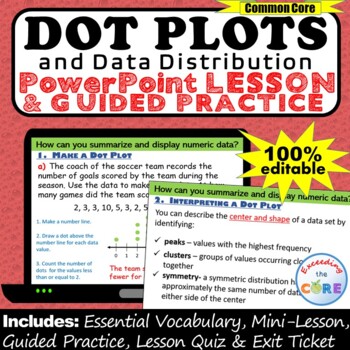
DOT PLOTS, LINE PLOTS & DATA DISTRIBUTION PowerPoint Lesson & Practice | Digital
Great for online learning and distance learning!Get your students successfully creating and using DOT PLOTS /LINE PLOTS and Data Distribution with this PowerPoint Presentation. This lesson begins with a focused mini-lesson and guided practice questions. It concludes with a lesson quiz and exit ticket to assess student understanding. All of the answers are included. This PowerPoint presentation is 100% editable, therefore you can modify any slide as needed.What is Included:_ Mini-Lesson with Gui
Subjects:
Grades:
6th - 8th
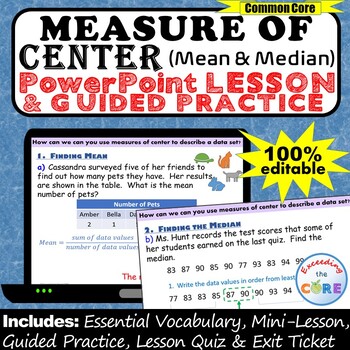
MEASURE OF CENTER (Mean, Median) PowerPoint Lesson & Practice |Distance Learning
Great for online learning and distance learning!Get your students successfully finding the MEASURE OF CENTER (Mean and Median) with this PowerPoint Presentation. This lesson begins with a focused mini-lesson and guided practice questions. It concludes with a lesson quiz and exit ticket to assess student understanding. All of the answers are included. This PowerPoint presentation is 100% editable, therefore you can modify any slide as needed.What is Included:_ Mini-Lesson with Guided PracticeThe
Subjects:
Grades:
5th - 7th
7th Grade Review Game | Jeopardy Game | Year Review
This fun, interactive and engaging 7th Grade Review game will have your students asking for more! Perfect for end of the unit or test prep. It can be use as a Jeopardy review game as a whole group, small group activity, or virtual learning. This NO PREP game is the PERFECT end of the year. Your students will have the chance to practice exercises on a fun and engaging way while competing with other classmates. Don’t worry about the animations, scoreboard, and interactive buttons. They are all set
Subjects:
Grades:
6th - 9th
Also included in: 7th Grade Review Games | Jeopardy Game | 7th Grade Practice
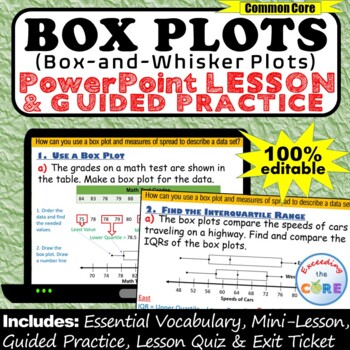
BOX PLOTS (Box-and-Whisker Plots) PowerPoint Lesson AND Guided Practice DIGITAL
Great for online learning and distance learning!Get your students successfully creating and using BOX PLOTS (Box-and-Whisker Plots) with this PowerPoint Presentation. This lesson begins with a focused mini-lesson and guided practice questions. It concludes with a lesson quiz and exit ticket to assess student understanding. All of the answers are included. This PowerPoint presentation is 100% editable, therefore you can modify any slide as needed.What is Included:_ Mini-Lesson with Guided Practi
Subjects:
Grades:
5th - 7th
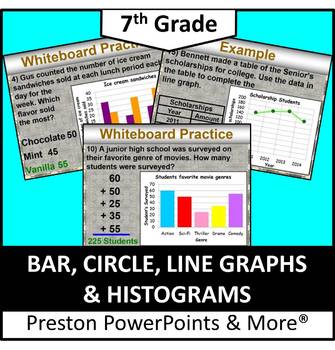
(7th) Bar, Circle, Line Graphs and Histograms in a PowerPoint Presentation
7th Grade Math Bar, Circle, Line Graphs and Histograms in a PowerPoint PresentationThis slideshow lesson is very animated with a flow-through technique. I developed the lesson for my 7th grade class, Pre-Pre-Algebra, but it can also be used for upper level class reviews. This lesson teaches how to interpret and create bar graphs, line graphs, circle graphs and histograms. Also, use tables to organize data and solve problems. NEW: The lesson is in an editable format so you can tailor the lesson
Subjects:
Grades:
6th - 8th
CCSS:
Mean, Median, Mode, Range Smartboard Slides Lesson Measures of Central Tendency
You'll LOVE this great Data Measures-of-Central-Tendency: Mean, Median, Mode, & Range Smartboard-Slides-Lesson. Your students will LOVE this interactive smartboard lesson that teaches and practices Mean, Median, Mode, and Range, along with a Card Game for practice. YOU GET 28 slides total, a very comprehensive and complete lesson. You'll enjoy using this great smartboard lesson year after year. WARNING: You MUST have SMART Technologies SMART software, and a SMARTBOARD to teach from, to effec
Subjects:
Grades:
4th - 7th
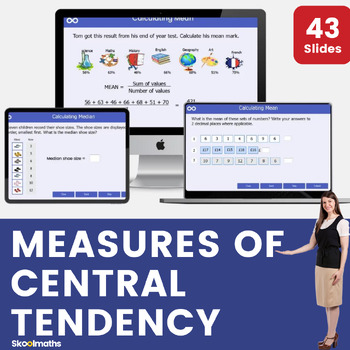
Measures of Center - Mean, Median, Mode and Range Interactive Math Lesson
Measures of Center - Mean, Median, Mode and Range Interactive Math LessonA completely interactive Middle school lesson for pupils in 6th grade on calculating averages. In this lesson, learners are able tocalculate measures of central tendency (mean, median, and mode);calculate measures of dispersion (range)understand interpretation and applicability of these measuresapply appropriate use of measures to compare data.The lesson can be used as whole class teaching by teachers and at home by learner
Subjects:
Grades:
6th - 7th
Also included in: Complete Statistics and Probability Bundle | Digital and Print
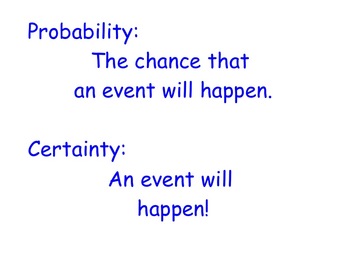
7th Grade CCSS Probability Unit Lessons
Complete 7th Grade CCSS Probability Unit Lessons.
This download includes all the lessons for the 7th grade probability unit and homework for each lesson. The entire lesson progression can be accessed for free on my site.
These lessons can be used independently or with video lessons that are available on my site. The video lessons are exceptionally useful with students that have been absent or are more advanced and need an independent study unit.
Subjects:
Grades:
6th - 8th
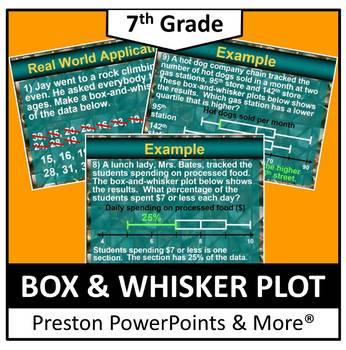
(7th) Box-and-Whisker Plot in a PowerPoint Presentation
7th Grade Math Box-and-Whisker Plot in a PowerPoint PresentationThis slideshow lesson is very animated with a flow-through technique. I developed the lesson for my 7th grade class, Pre-Pre-Algebra, but it can also be used for upper level class reviews. This lesson teaches how to draw a box-and-whisker plot to organize real-life data, interpret box-and-whisker plot data and with outliers, compare two sets of data describing possible associations between the two variables.NEW: The lesson is in a
Subjects:
Grades:
6th - 8th
CCSS:
Deal or No Deal 7th Grade Math Spiral Review Jeopardy
This game is great for end of year review. It is designed for the academic enrichment of your students. It is a great whole class game that can be used with or without an interactive whiteboard.
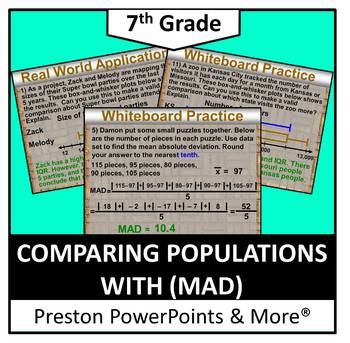
(7th) Comparing Populations with (MAD) in a PowerPoint Presentation
7th Grade Math Comparing Populations with (MAD) in a PowerPoint PresentationThis slideshow lesson is very animated with a flow-through technique. I developed the lesson for my 7th grade class, Pre-Pre-Algebra, but it can also be used for upper level class reviews. This lesson teaches how to use measures of center and variation to compare populations and use random samples to compare populations.This lesson has SKELETON NOTES, notes that have the problem only. I used this with our 1-1 district
Grades:
6th - 8th
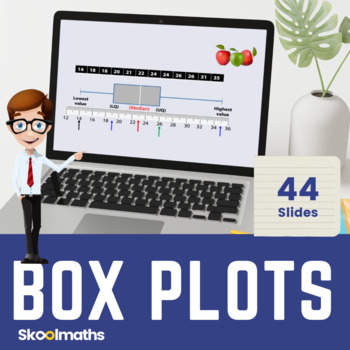
Box and Whisker Plots Digital Lesson and Activities for Middle School
Box and Whisker Plots Digital Lesson and Activities for Middle SchoolBox Plots is a completely interactive lesson designed for Middle school to High School Statistics and Probability.Contents:This bundle pack contains:44 interactive slides with dynamic graphics that will engage your studentsInteractive Drag and Drop activities on find averages as well as instant learner feedbackPrintable Worksheets with answers includedDifferentiated questions and answersCan be used as Home Learning Resource and
Subjects:
Grades:
6th - 9th
Also included in: Complete Statistics and Probability Bundle | Digital and Print
Median Mode Range Smartboard Slides Lesson Measures of Central Tendency
Incredible ~ 31 slides ~ Smartboard-Slides-Math-Lesson over Median, Mode, and Range (Measures of Central Tendency). This is EVERYTHING you need to teach these three measure-of-central-tendencies. Students will enjoy the interactive slides where they work problems at the Smartboard. Please be sure to see my other smartboard lesson on Finding the Mean, Average. You'll enjoy using this resource year after year. WARNING: You MUST have SMART Technologies SMART software, and a SMARTBOARD to teach from
Subjects:
Grades:
4th - 7th, Staff
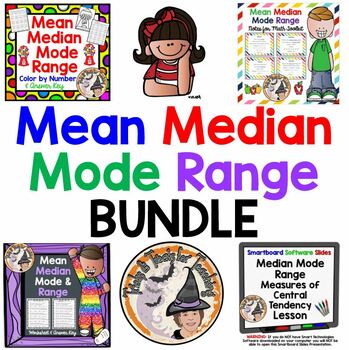
Mean Median Mode Range Color by Number Worksheets Notes Smartboard BUNDLE
Save some MONEY on this WONDERFUL-Bundle of resources to teach Mean-Median-Mode-Range. You get a Color-by-Number Answer Worksheet, along with Notes and an additional worksheet, and a Smartboard Slides Lesson all on Mean Median Mode and Range. Great variety for Differentiation and Spiraling Concepts too! You'll enjoy using these year after year!Be sure to L@@K at my other 1,285+ TERRIFIC teaching resources!~ ~ THANK YOU KINDLY ~ ~
Subjects:
Grades:
6th - 7th
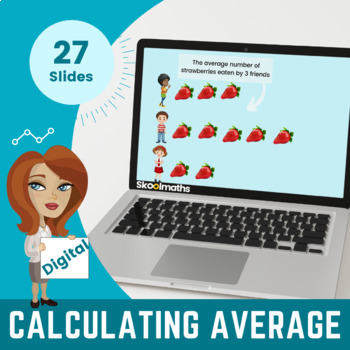
Calculating Averages - 6th Grade Digital Learning CCSS.6.SP.A.1
Want an interactive maths lesson for students that will help your sixth grade to practice Calculating Averages? In this fun-packed digital maths lesson, your grade 6 students will learn how to calculate the mean, median, and mode. This lesson is completely interactive with drag and drop activities that will engage and motivate your learners!Contents:This bundle pack contains:27 interactive slides with dynamic graphics that will engage your studentsInteractive Drag and Drop activities on find ave
Subjects:
Grades:
6th - 7th
Showing 1-24 of 31 results


