13 results
6th grade Common Core 7.SP.B.4 resources for Easel Activities
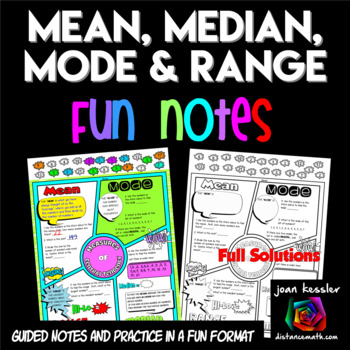
Measures of Central Tendency FUN Notes Doodle Pages
Your students will love learning the Measures of Central Tendency with these Fun Notes done in a comic book theme. Topics include Mean, Median, Mode, and Range. Students complete 6 problems plus definitions. There are two versions of the notes so you can differentiate. The PDF also includes 2 sizes, one standard 81/2 x 11" and the other in half size for INB's. Students love to doodle while learning and it has been shown that doodling and working with fun themed activities help students engage
Subjects:
Grades:
6th - 9th
Also included in: Algebra 1 FUN Notes Doodle Page Bundle
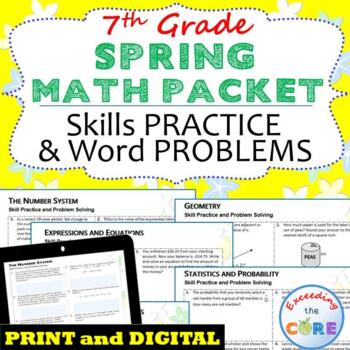
7th Grade SPRING / April MATH PACKET {Review/Assessments of Standards}
This 7th Grade SPRING Math Packet has it all and requires NO PREP! The resources in this packet are designed to meet the state standards for 7th grade math.What is Included:I have included questions from each of the 7th grade domains, and each domain(topic) is on a different page so that you may customize this packet as needed. These questions are aligned to the 7th grade learning standards, making this the perfect resource for fluency and problem solving.Topics Include* page 2 - The Number Syst
Subjects:
Grades:
6th - 8th
Types:
Also included in: 7th GRADE MATH Assessments, Warm-Ups, Task Cards, Worksheets BUNDLE
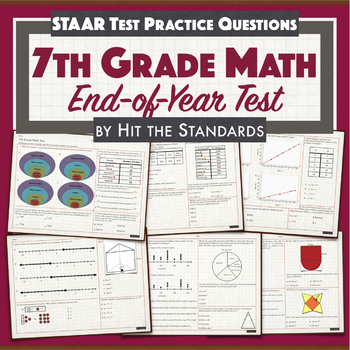
7th Grade Math Test Standard Based Review Benchmark Pretest STAAR End of Year
This Resource consists of 25 standardized questions, very similar to state assessment questions, and can be used as a benchmark, review packet, end of year homework, test prep problems, or even as a final exam since it covers most 7th Grade Math standards. Includes: ratios and proportional relationships, angle measure, area, surface area, volume, dot plots, probability, drawing inferences, sets of rational numbers, interest rate, taxes, percentage, solving real-life and mathematical problems usi
Subjects:
Grades:
6th - 8th
Types:
Scientific Method Activity Practice Data Analysis Qualitative and Quantitative
This activity has students collect QUALITATIVE and QUANTITATIVE DATA about the candy in a mixed pack, such as Skittles or M&Ms. There are many candy activities out there, but none quite covered the quantitative and qualitative skills I wanted my middle school students to practice, so I designed my own! This lab is designed to be simple so that students can master beginner lab and data collection skills.In this activity, students will:READ an article about the differences between qualitativ
Subjects:
Grades:
6th - 8th
Types:
Also included in: Introduction to Experimentation Activity Set for Middle School Science
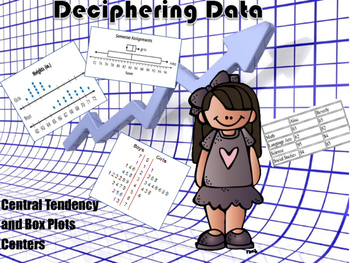
Central Tendency & Box Plots Centers with Mean Absolute Deviation
This is a collection of centers that I created for review. There are five central tendency centers, five box plots centers, and five mean absolute deviation centers. Each card has several questions that require calculations and analyzing information. I printed them out on card stock paper and made cards out of them with the answers on the back of each card. This is a great way to review these concepts.
Subjects:
Grades:
4th - 8th
Types:
CCSS:
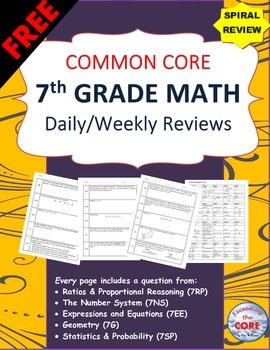
7th Grade Math Common Core Daily / Weekly SPIRAL REVIEW {2 Weeks FREE}
This FREE resource contains 2 WEEKS (10 problems) of review specifically written for the common core math standards for 7th grade. The review sheets are organized into 5 boxes. Each box contains problems from the 5 domains of the 7th grade CCSS standards.
This resource can be used for WARM UPS, HOMEWORK and math CENTERS. This is also a great resource for test prep.
*Get the FULL DOWNLOAD here! {20 WEEKS}
Being a 7th grade teacher myself, I created this resource to give my students daily and
Subjects:
Grades:
6th - 8th
Types:
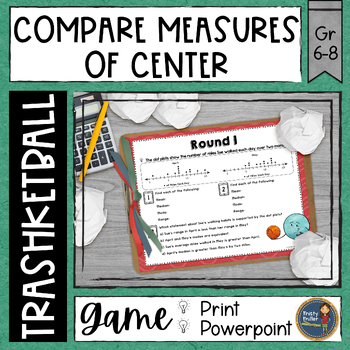
Compare Measures of Center Trashketball Math Game
Get your students engaged and moving while they solve problems comparing measures of center. Compare Measures of Center Trashketball is a competitive and motivating math game that involves students working with mean, mode, median, range, quartiles, and interquartile range and shooting baskets at the end of each round. There are 4 rounds in this game with 3 questions in each round. This resource includes a PDF & PowerPoint Slides. What's Included:✓ PDF that includes teacher information, blac
Subjects:
Grades:
6th - 7th
CCSS:
Also included in: Trashketball Math Games Bundle - All Games
Find the Error - Data and Graphs with Central Tendency and Variation
This is an activity that I created for my students to find the mistake when a student has answered questions from graphs about measures of center and variation incorrectly. I used common errors to help them see the mistakes commonly made. All of my products are common core aligned.I had the students work alone to solve the problems first, and then share with their groups. If there was any discrepancy, they looked in the answer folder on their tables to see the correct answer. I rotated around
Subjects:
Grades:
5th - 7th
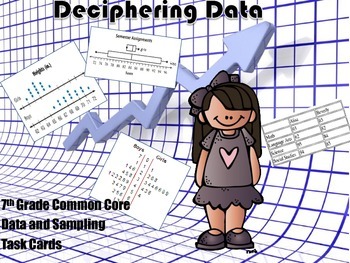
Data and Inferences Task Cards - Common Core Aligned
This is a set of 36 task cards covering 7th grade common core math concepts involving data. In the set, there are computation problems, conceptual problems, and problem solving problems. My students love this alternative way of practicing and discussing math. It leads to some very rich discussions!
If you bought my Deciphering Data Board Game, don't buy this because it has a lot of the same questions.
Subjects:
Grades:
6th - 7th
Types:
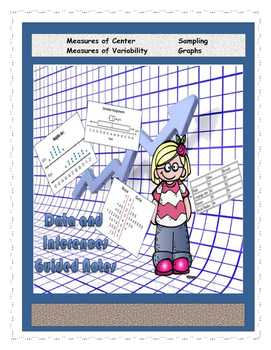
Data, Graphing, and Sampling Interactive Notes
I use this as interactive notes with my students. Included in the notes are vocabulary, examples, dot plots, box plots, histograms, stem and leaf plots, measures of center, measures of variation, population, and sampling.
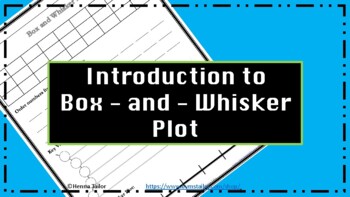
Box and Whisker Plot
Students will be able to understand how to create and draw box and whisker plot diagrams through an activity that is student-centered and visual with some teacher-direction.This activity can be adapted for other data* rather than just heights of the students. *You can use height, how far a student can jump all starting at the same line, or even how far to throw a cotton ball -the examples are endless.This activity goes great with the comparison activity (this also has a color-coded answer key) -
Subjects:
Grades:
6th - 8th
Types:
CCSS:
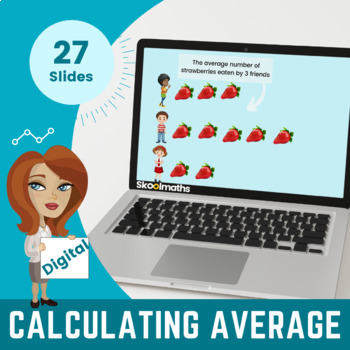
Calculating Averages - 6th Grade Digital Learning CCSS.6.SP.A.1
Want an interactive maths lesson for students that will help your sixth grade to practice Calculating Averages? In this fun-packed digital maths lesson, your grade 6 students will learn how to calculate the mean, median, and mode. This lesson is completely interactive with drag and drop activities that will engage and motivate your learners!Contents:This bundle pack contains:27 interactive slides with dynamic graphics that will engage your studentsInteractive Drag and Drop activities on find ave
Subjects:
Grades:
6th - 7th
Probability Cloze Notes
Cloze notes and/or study guide on probability for middle school math students. Includes theoretical and experimental probability as well as compound probability. Aligned with the 2016 Virginia Mathematics SOLs 7.8 and 8.11 and CCSS 7.SP.B.3, 7.SP.B.4, 7.SP.C.5, 7.SP.C.6, 7.SP.C.7, and 7.SP.C.8.With clip art from:Maps of the World and Fun For Learning.
Subjects:
Grades:
6th - 9th
Showing 1-13 of 13 results


