
PROBABILITY: 7th Grade PowerPoint Lessons DIGITAL BUNDLE


- Zip
- Internet Activities
Products in this Bundle (7)
showing 1-5 of 7 products
Also included in
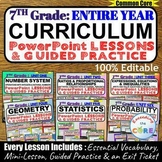 Get your students to successfully understand the 7th Grade MATH CURRICULUM (all units) with this PowerPoint Presentation BUNDLE.This bundle includes 38 PowerPoint Lessons that are designed to teach the ENTIRE 7th Grade Math Curriculum. Each lesson starts with a mini-lesson and guided practice questPrice $119.70Original Price $133.00Save $13.30
Description
Get your students to successfully understand the 7th Grade PROBABILITY Unit (experimental and theoretical probability) with this PowerPoint Presentation BUNDLE.
This bundle includes 7 PowerPoint Lessons that are designed to teach students how to describe the likelihood of simple and compound events. Students will also be able to make predictions with experimental and theoretical probability.
These lessons cover the entire PROBABILITY unit. Each lesson starts with a mini-lesson and guided practice questions. Every lesson concludes with a lesson quiz and exit ticket to assess student understanding. All of the PowerPoint presentations are 100% editable, therefore you can modify any slide as needed.
This BUNDLE includes all of the following PowerPoint Lessons:
- Probability
- Experimental Probability of Simple Events
- Experimental Probability of Compound Events
- Making Predictions with Experimental Probability
- Theoretical Probability of Simple Events
- Theoretical Probability of Compound Events
- Making Predictions with Theoretical Probability
Each Lesson Includes:
✔️Mini-Lesson with Guided Practice
The mini-lesson for each lesson includes essential vocabulary and key terms for that topic. Students are then guided through scaffolded instruction with guided practice questions for each lesson objective. All of the math problems are worked out step-by-step with detailed explanations.
✔️Lesson Quiz
Every lesson ends with a lesson quiz that includes questions from each topic of this lesson. This is perfect for assessing your students' understanding of this lesson. Have students complete these questions individually or with a partner.
✔️Exit Ticket
An exit ticket question is included at the end of each presentation. Have students write the answer on a post-it and turn it into you on their way out the door.
How to Use:
These digital lessons are perfect for distance learning or in-person learning. They are scaffolded and students can use them on their own or you may present them to your students. Students are able to follow along while completing the guided practice questions in their notebooks or own their devices. Each lesson is about 30-35 minutes.
If you would like to get updates on NEW and CURRENT resources...
FOLLOW the Exceeding the Core BLOG!
FOLLOW me on Teachers Pay Teachers!
© Exceeding the CORE. All rights reserved. Please note - this resource is for use by one teacher only. Additional teachers must purchase their own licenses. Copying, editing, selling, redistributing, or posting any part of this product on the internet is strictly forbidden. Violations are subject to the penalties of the Digital Millennium Copyright Act.
