254 results
Statistics resources for Microsoft Word $5-10
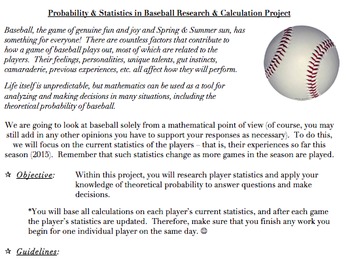
Probability & Statistics in Baseball Project (Common Core Aligned, AND FUN!)
The problems and activities within this document are designed to assist students in achieving the following standards: 6.SP.B.5, 7.SP.C, HSS.CP.A.2, HSS.CP.A.3, HSS.CP.B.7, HSS.CP.B.9, as well as the standards for mathematics practice and the literacy standards. They are also designed to help the teacher assess the students’ abilities when it comes to working with the ideas within the standards.This document contains the following:A project designed to allow students to investigate theoretical
Subjects:
Grades:
5th - 12th, Higher Education, Adult Education, Staff
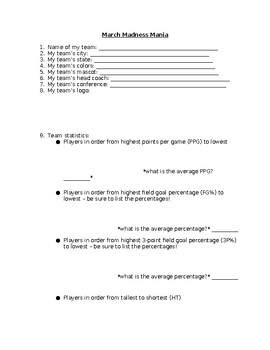
NCAA March Madness Basketball Tournament Team Research Statistics
Do you have students interested in the March Madness basketball tournament? Then this is the activity you need!To begin our March Madness unit, we look at all of the teams participating in the tournament and complete a map together to show where each team is from. We notice that some states have more than others and some states have none, and spend time discussing why that might be. Students will complete their own March Madness bracket.Students will then select a team in the NCAA March Madness
Grades:
4th - 9th
Types:
Cards Probability Scavenger Hunt Activity
A mix of 26 addition rule, multiplication rule, and conditional probability questions about a standard deck of cards. Find the cards in question to lead you to the next problem! This resource is a word document so you may edit it to your liking. I made this activity for my CP Probability&Statistics class - but it is also challenging enough for an AP level statistics class. It generally takes about two class periods - but my kids LOVE it and it is GOOD practice. The problems may be a little t
Subjects:
Grades:
9th - 12th, Higher Education
Types:
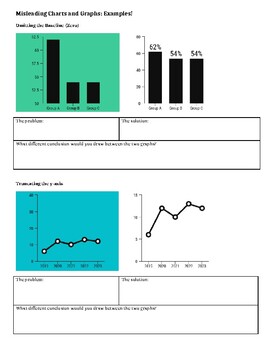
Misleading Charts and Graphs Analysis
This lesson outlines the four most common ways that writers and journalists display graphs that can cause people to draw incorrect conclusions. Students look at examples of bad graphs along with corrected versions and explain why one version is misleading and the other is correct. Independent practice is provided for the students to demonstrate understanding as well.
Subjects:
Grades:
Not Grade Specific
Types:

My Lego House
This is a 2-3 week maths project for anyone from Grade 3-6. Done in pairs or small groups the project entails students designing and building their own Lego house. In the project students will cover a range of maths concepts including area, perimeter, counting, money, graphing and interpreting data. The project includes a detailed teacher booklet with photographs of student's work and examples for each of the lessons. The student book is also included for students to work from, although we found
Subjects:
Grades:
3rd - 6th
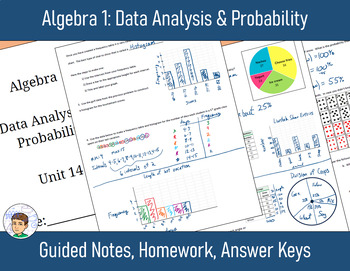
Algebra 1 Unit 14: Data Analysis & Probability - Notes, Homework, Answers
This unit is a great resource for any math course looking to add a supplementary unit on Data Analysis and Probability. You are buying guided notes, notes keys, homework assignments, and answers for a 6 lesson unit. This unit is based on a traditional Algebra 1 curriculum.Please check out the preview file to see what the unit will look like.This Word document makes it easy for you to modify, edit, or copy and paste to make your own reviews and tests for the unit.Topics covered in this unit are:R
Subjects:
Grades:
7th - 10th
Types:
Probability and Statistics March Madness Project
In this activity, students fill out a March Madness bracket by using the formula. Then, you will simulate each game to determine the winner. Then they fill out a March Madness bracket by selecting who you think will win. Let them do the research and discuss. It can be based on research of team and player statistics, the team name they like the most, the team mascot they like the most, or any other criteria they can think of! At the conclusion of the tournament, we will revisit this activity
Subjects:
Grades:
9th - 12th, Higher Education
Types:
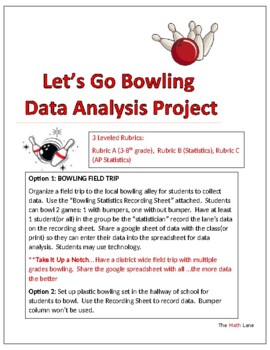
Let's Go Bowling Statistics STEM Project & Field Trip (3-12 and AP Stat)
Great END OF YEAR project. Get ready to strike up some fun with your students on a field trip to the bowling alley or right in your own hallway with a plastic bowling set! This isn't just any ordinary field trip - it's a real-world data collection extravaganza. 3 different leveled rubrics (Grade 4-10, Statistics, AP Statistics) so students can analyze the data based on their math knowledge. Students will be able to practice creating and analyzing graphical displays, scatterplots, construct c
Subjects:
Grades:
Not Grade Specific
Types:
Also included in: High School Statistics Project Bundle
High School Math IEP Goal Bank - Statistics and Probability
This IEP goal bank was created to assist special education teachers with the task of writing standards-based IEP goals in math. After spending countless hours developing IEP goals myself and really having to think through how to best individualize goals and objectives for my own students, I wanted to share this resource to help other special education teachers gain back some of their time.This goal bank includes the following:An introduction and guide that explains how to use the document.Each s
Subjects:
Grades:
9th - 12th
CCSS:
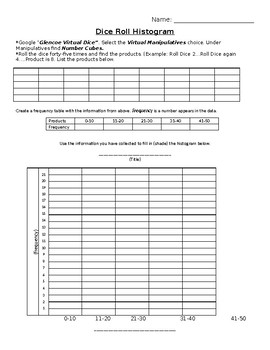
Dice Roll Histogram - Online Interactive Activity Frequency Table & Historgram
Students will complete a frequency table and histogram that corresponds to data collected through the use of rolling two dice (Statistics Lesson). To get the data for this frequency table, students will roll two dice and multiple the numbers rolled together. The product of these two rolls will be the data point. Students will write down each product, rolling their dice a total of 45 times. Students will then fill in the frequency table and graph on a histogram. We used an online dice. This helps
Subjects:
Grades:
5th - 8th
Types:
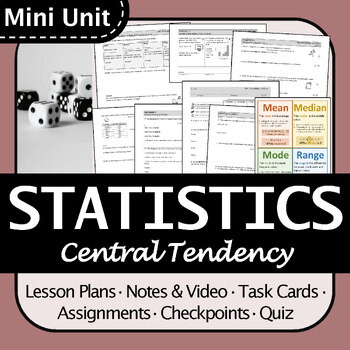
BC Math 8 Measures of Central Tendency Mini Unit, Engaging, Differentiated
This is an engaging mini unit that would work great for an in-depth look at measures of central tendency (mean, median, mode, and range) and how to choose them. The resources are well-organized and differentiated so they are accessible to a wide range of students.Students learn:How to calculate mean, median, mode, and range from a data set or frequency table.How to choose the best measure of central tendency (mean, median, or mode) given a particular situation or data set. Includes:Detailed les
Subjects:
Grades:
6th - 9th
Types:
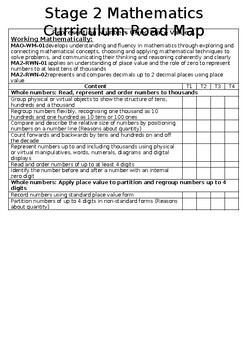
NSW STAGE 2 MATHEMATICS CURRICULUM ROADMAP (NEW K-6 SYLLABUS)
Template of a Stage 2 Roadmap for the new NSW Mathematics SyllabusThis template has a simple layout that will allow you to highlight the different Mathematic learning areas to cover throughout the year. It covers the content areas in Part A and Part B. It is organised in a way that is reflective of the live document from the NSW Curriculum website.A great tool to use for your staff planning days at the beginning of the year or each term.
Subjects:
Grades:
3rd - 4th
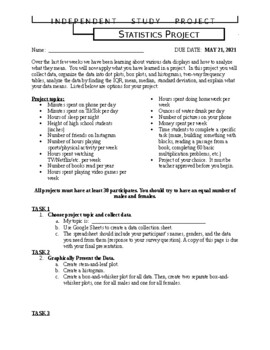
Algebra 1 - Statistics Project
Tired of doing tests? Especially by the time you get to the statistics chapter, you and your students both probably are! Here is an alternative summative assessment for you!This statistics project tasks students with conducting a survey to collect data. Then, students must graphically represent the data, analyze the data by performing statistical calculations, and interpret the data.Students really enjoy this project!!
Subjects:
Grades:
7th - 10th
Types:
Statistics Multiple Choice Exams; Randomized & Preselected Qs
These are the available tests.Statistics Review (40 Random Qs)Multiple Choice Exam 01 (40 Preselected Qs)Multiple Choice Exam 02 (40 Preselected Qs)Multiple Choice Exam 03 (40 Preselected Qs)The download will have the URL, username, and password to the Canvas online testing system.After you log in, you will be able to take the stats assessmentsYour account will stay active for 6 monthsIf you use Canvas as your testing platform, this quiz can be installed, administered, will self-grade, and updat
Subjects:
Grades:
Not Grade Specific
Types:
AP Statistics: An Outline of Lessons and Homework Assignments
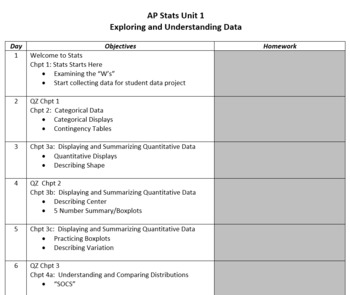
This file contains a brief layout of what can be taught in class for each day in the AP Statistics course. Created to fit a standard block class using BVD's Stats: Modeling the real world 4th Edition. While the homework assignments are specific to the 4th edition, they can be used similarly along with the other additions but you may wish to preview the problems first!
All assignments mentioned within are contained in the BVD teacher's documents/edition. Clear placement of when to assign "Inve
Subjects:
Grades:
10th - 12th
Types:
Santa's Workshop : Interactive Lab
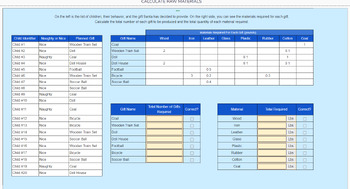
Students will calculate the material required for providing gifts for 25 children, and then learn and use spreadsheet functions to calculate for 1000 children.Preview Link: Lab previewAssign this interactive and digital lab to your classroom now.Detailed Description:Santa uses a Naughty and Nice list to choose the gift for each child. For nice children, they get the gift they most desire. For naughty children, they get a lump of coal.Students are provided with a small list of Naughty and Nice ch
Grades:
10th - 12th
Types:
Mini Unit: Percents & Percent of a Number | Fun, Engaging, Differentiated!
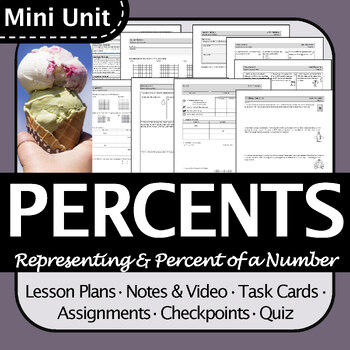
This is an engaging mini unit that would work great for an in-depth look at representing percents and percent of a number. The resources are well-organized and differentiated so they are accessible to a wide range of students.Students learn:Representing percents (visually, decimals, fractions)Percent of a number in multiple ways (mental math, multiplying)Includes:Detailed lesson plans 2 number talks2 sets of comprehensive and visual scaffolded notes (with lesson video).2 Sets of task cards for
Subjects:
Grades:
6th - 9th
Types:
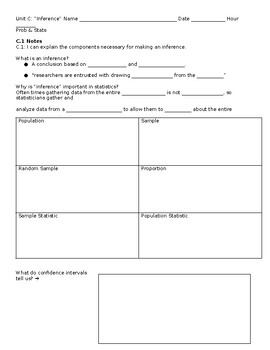
Probability and Statistics Unit C Inference Notes and Practices (All Materials)
Probability and Statistics Unit C Inference Notes and Practices (All Materials)
Subjects:
Grades:
9th - 12th
Types:
Two-way table Project
This project is designed to help students understand bivariate data association through the creation of a two-way table. Students need to randomly select 90 students to survey two questions of their choosing. The students need to choose two questions that compare things they think may have a relationship. This project provides students with the boxes to record results, create their two-way table, and create relative frequencies to analyze the results. Finally, this project comes with a grading r
Subjects:
Grades:
8th - 11th
Types:
CCSS:

2012 London Summer Olympics Unit
My friend and I designed this unit for our M.Ed. program's math methods course. Being in a math placement for student teaching, we wanted to create a unit based on a relevant theme that would interest our students. Our London Olympics unit consists of four full lesson plans with created student handouts. The lessons are designed around 7th grade common core standards: ratios and proportional relationships, expressions and equations, geometry, and statistics and probability.
The lessons go th
Subjects:
Grades:
6th - 8th
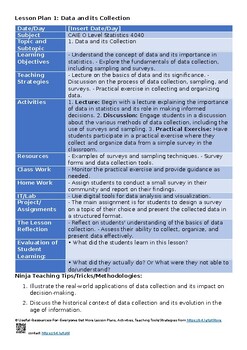
1. Data and its collection -O Level Statistics 4040Lesson Plans Unit Plans Thema
Dive into the World of Data Collection with Our Comprehensive Lesson Plans! Title: Data and its collection - O Level Statistics 4040 Lesson Plans Unit Plans Thematic Lesson Plans Explore the exciting world of data collection with our meticulously crafted lesson plans. "Data and its collection - O Level Statistics 4040 Lesson Plans Unit Plans Thematic Lesson Plans" offers an enriching learning experience for both students and teachers. Key Features:✨ Syllabus Aligned: Our lesson plans are metic
Subjects:
Grades:
5th - 12th, Adult Education, Staff
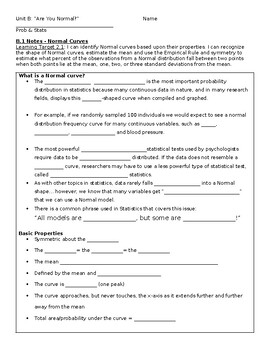
Probability and Statistics Unit B Normal Distribution Notes and Guides
Probability and Statistics Unit B Normal Distribution Notes and Guides (pairs With Unit B Powerpoint Lecture)
Subjects:
Grades:
9th - 12th
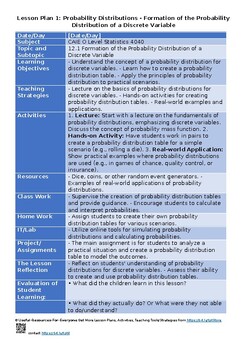
12. Probability distributions -O Level Statistics 4040 Lesson Plans Unit Plans T
Explore Probability Distributions with Our Comprehensive Lesson Plans! Title: Probability Distributions - O Level Statistics 4040 Lesson Plans Unit Plans Thematic Lesson Plans Delve into the fascinating world of probability distributions with our meticulously crafted lesson plans. "Probability Distributions - O Level Statistics 4040 Lesson Plans Unit Plans Thematic Lesson Plans" offers a comprehensive understanding of this vital statistical concept, equipping students with essential knowledge.
Subjects:
Grades:
5th - 12th, Adult Education, Staff
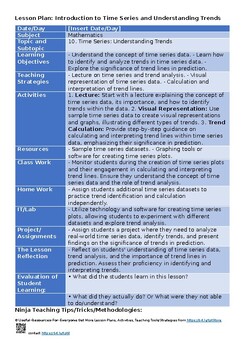
10. Time series -O Level Statistics 4040 Lesson Plans Unit Plans Thematic Lesson
Explore Time Series with Our Comprehensive Lesson Plans! Title: Time Series - O Level Statistics 4040 Lesson Plans Unit Plans Thematic Lesson Plans Delve into the intriguing world of time series with our meticulously crafted lesson plans. "Time Series - O Level Statistics 4040 Lesson Plans Unit Plans Thematic Lesson Plans" offers comprehensive insights into this statistical concept, equipping students with a strong foundation. Key Features:✨ Syllabus Aligned: Our lesson plans are in perfect ha
Subjects:
Grades:
5th - 12th, Adult Education, Staff
Showing 1-24 of 254 results


