3 results
Graphing resources for Microsoft Word on sale

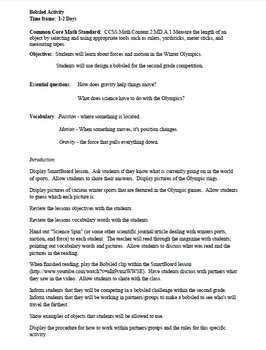
STEM Bobsled Olympic Lesson
Students are to work in groups or pairs and design a bobsled. Students will be provided with a toilet paper role, two popsicle sticks, two pipe cleaners, and 1 foot of masking tape. If students wish to brings small things from home, that is okay. Allow students to think through their design. Allow a trial run, and then allow modifications for improvement after the trail run. Hold a final event and display the gold, silver, and bronze winners for this event. This event is fun and engaging.
Subjects:
Grades:
1st - 8th
CCSS:

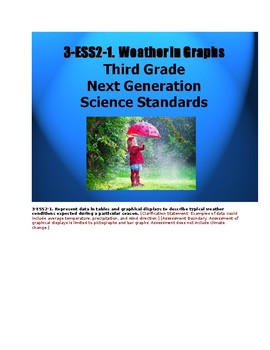
3 ESS2-1 Graphing Precipitation
3-ESS2-1. Represent data in tables and graphical displays to describe typical weather conditions expected during a particular season. [Clarification Statement: Examples of data could include average temperature, precipitation, and wind direction.] [Assessment Boundary: Assessment of graphical displays is limited to pictographs and bar graphs. Assessment does not include climate change.]5 Key City Locations in the Nation with Real Data from NOAA January 20177 Types of Precipiation - THUNDERSTORM
Subjects:
Grades:
3rd

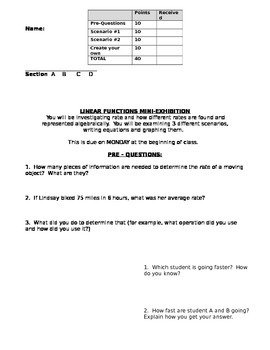
Linear Functions Project - Comparing Rates
Students will look at two different scenarios both of which compare the rates of multiple moving objects. They compare them literally, algebraically and graphically. Then they create their own scenario that compares rates.
Grades:
8th - 9th
Types:
CCSS:
Showing 1-3 of 3 results


