18 results
Valentine's Day arithmetic Common Core 7.SP.B.4 resources
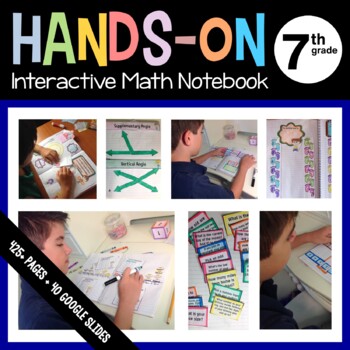
Math Interactive Notebook Seventh Grade with Scaffolded Notes + Google Slides
Interactive Math Notebook for Seventh Grade - 473 pages - answer keys included! Great for distance learning! This huge bundle has everything you need for a full year of teaching seventh grade math:A 245-page hands-on interactive math notebook including answer keys100 pages of scaffolded notes including answer keys86 pages of interactive printables including answer keys42 Google Slides of the same interactive printablesReal Feedback from Teachers"I love TPT, but I may have found the ultimate prod
Grades:
6th - 8th
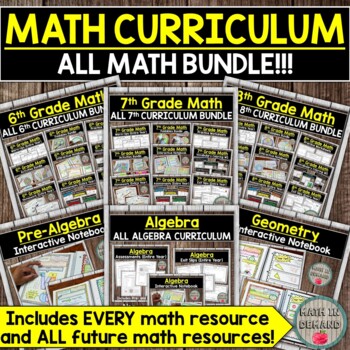
Entire Math Curriculum Bundle (All Math Resources)
⭐ This bundle includes ALL of my Math Curriculum in my Teachers Pay Teachers store ⭐You will be receiving ALL of my 6th, 7th, and 8th Grade Math interactive notebooks, activities, foldables, practice worksheets, warm-ups, exit slips, assessments, and much more! This is well over 1000 pages of material that I have created to help make math more enjoyable to students. My material also helps students to make connections to the real world.In addition to all of the math material in my store, you will
Subjects:
Grades:
5th - 10th
Types:
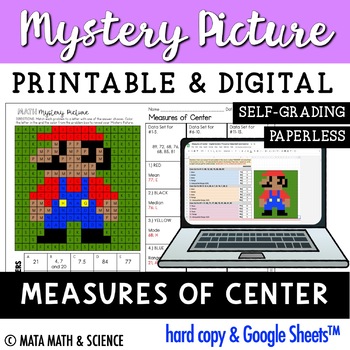
Measures of Center: Math Mystery Picture
About this resource:In this challenge, students solve 15 measures of center problems, finding the mean, median, mode, range and interquartile range (IQR) of three different data sets. Each correct answer will reveal a bit of the mystery picture. Students will be motivated to complete the math problems until all pixels are revealed!What's included?Printable Mystery PictureGoogle Sheets™ versionInteractive Notebook Cover SheetShow work templates (small and large boxes)Answer keyStandards alignment
Subjects:
Grades:
6th - 9th
Also included in: Every Single Math Mystery Picture: Growing MEGA BUNDLE for Middle School
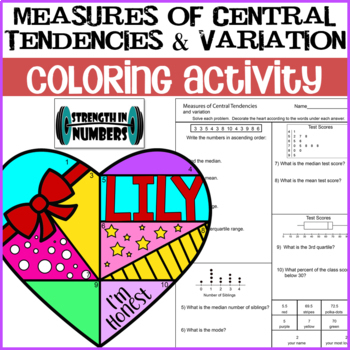
Measures of Central Tendencies & Variation Valentine's Day Coloring Activity
Students will answer 10 data questions including mean, median, mode, range, quartiles, and interquartile range using lists, dot plots, box plots, and stem-and-leaf plots. This worksheet is self checking - answers are at the bottom and students will use the description under the answer to decorate the heart. All my favorite things - colorful, self-checking, and wall-worthy! These are fantastic hung around the classroom for Valentines Day (or anytime your classroom needs a little LOVE) because
Subjects:
Grades:
5th - 8th
Types:
CCSS:
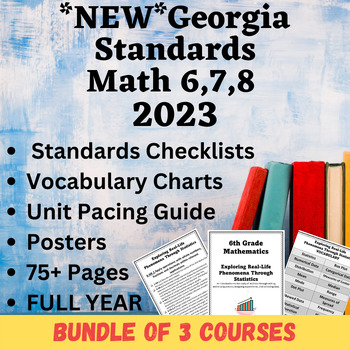
NEW! Georgia 6th7th8th Grade Math Standards2023 Posters,Checklists,&Vocabulary
*BUNDLE of RESOURCES*Georgia has just released NEW math standards for 6th,7th,&8th grade 2023!*THIS DOCUMENT IS EDITABLE*Suggestions From The Seller:•Teach the NEW GEORGIA MATH STANDARDS 2023 using standards checklists/chart•Print on colored cardstock & laminate•Create posters for the board and use a dry-erase marker to check the learning targets for the day•Place in your teacher portfolio as you collect student work from each unit•Print for student interactive notebooks to check standar
Tree Diagrams and the Fundamental Counting Principle Smartboard Lesson
Teachers ~ You'll LOVE this! One of my best-selling Smartboard Lessons, that has 23 slides total. Great graphics and everything you'll need to teach Tree Diagrams and the Fundamental Counting Principle. Lots of interactive practice with students coming to Smartboard to solve problems too. You're students will love learning from these Smartboard Slides. WARNING: You MUST have SMART Technologies SMART software, and a SMARTBOARD to teach from, to effectively download, open and use this Interactive
Subjects:
Grades:
4th - 7th
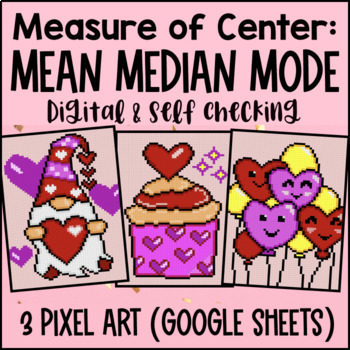
Mean Median Mode Digital Pixel Art Measures of Central Tendency & Center
Take measures of central tendency practice to the next level with pixel art! Students practice finding the mean, median, and mode of different datasets across 3 pixel art activities with 36 problems total. It's a perfect addition to your data & statistics unit.These self-checking Google Sheets give students instant feedback. Incorrect answers are highlighted in red, and correct answers turn green and unlock parts of a mystery picture. They’re easy to assign, keep students engaged, and free u
Subjects:
Grades:
6th - 7th
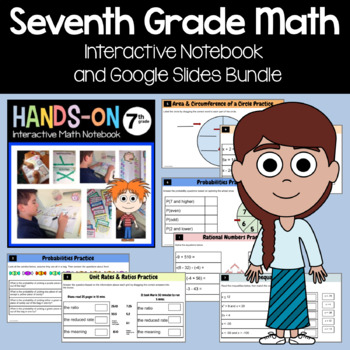
Math Interactive Notebook 7th Grade + Google Slides Bundle | 30% off
Interactive Math Notebook for Seventh Grade + Google Slides - 937 pages! ANSWER KEYS ARE INCLUDED! This huge bundle has everything you need for a full year of teaching seventh grade math:A 245-page hands-on interactive math notebook including answer keys100 pages of scaffolded notes including answer keys500+ Google Slides focusing on different math concepts for seventh grade42 Google Slides50 Interactive PrintablesGoogle Slides2 Google Slides Presentations: One Google Slides Interactive Presen
Grades:
6th - 8th
Types:
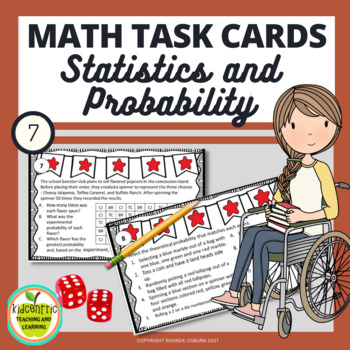
Math Task Cards - Statistics and Probability
Great versatile and engaging resource for reviewing the concepts of probability and statistics. Your seventh graders will be actively engaged as they use random sampling to draw inferences about a population, draw informal comparative inferences about two populations, and investigate, use, and evaluate probability models. There are many ways you can use these NO PREP cards with your 7th grade math class. Think how easily you can just print and use these cards with activities such as:Bellwork
Subjects:
Grades:
6th - 8th
Types:
Measures of Central Tendency. (mean, median, mode, range and outliers)
An Activity to review and practice finding Measures of Central Tendency. (mean, median, mode, range and outliers)
Students will collect data by measuring the length of their body parts. In groups, they will find the measures of central tendency of the data, determine the most appropriate data representation and then create the average or "Mean" student in their class by drawing on poster board and putting together. Great activity for collaborative learning, observations, data collection and me
Subjects:
Grades:
6th - 7th
Types:
CCSS:
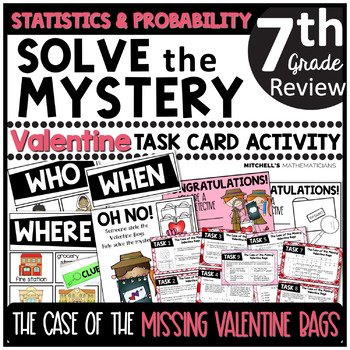
7th Grade Statistics and Probability Solve The Mystery Valentine's Day Task Card
I am excited to share this Valentine's Day MYSTERY CHALLENGE activity with you and your students! You will begin this task card activity by reading a short story that will challenge your students to solve the case of the missing valentine bags. They will have to find out who took them, when they took them, and where they put them. To solve the case, students will work to complete 9 different task cards. The task cards are based on the 7th grade statistics and probability CCSS. Once they complete
Subjects:
Grades:
6th - 8th
Types:
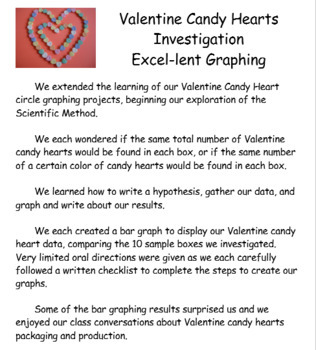
Excel Graphing Valentine Candy Hearts Investigation
#welovecandyheartsThis integrated Math/ Science/ Technology project is a great way to make statistics and probability real, relevant, fun, and delicious!Students will create bar graphs using Excel to display Valentine candy hearts data, as students consider packaging and production of small Valentine candy heart individual boxes. Project file includes sample bulletin board display poster, project directions in individual student checklist form, and rubric to grade the finished graph.Project file
Grades:
5th - 7th
Types:
NGSS:
3-5-ETS1-2
, MS-ETS1-3
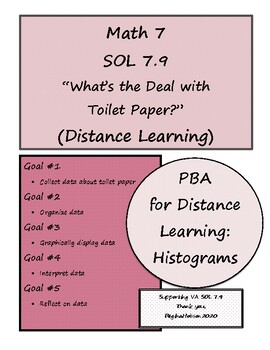
Math 7 VA SOL 7.9 Distance Learning: Toilet Paper Histograms and Graphs
Thank you for downloading this Performance Based Assessment that supports the lessons taught in my Unit 7 on Histograms. Students will collect, organize, display data graphically, and interpret data concerning the number of rolls of toilet paper in individual households. Since I am “remote teaching” at the moment, I created this resource for my students to review their histogram skills with a topic that is currently in the news. Look for more “Distance Learning” lessons to be added to my TpT sto
Subjects:
Grades:
6th - 8th
Types:
7.SP Statistics and Probability Student Data Folder
The attached pages give you everything you need to get started on student data folders in your classroom. The pages can be inserted into the student data folder for students to be active participants in their learning and monitoring their growth through each standard.
The attached files are only for the 7.SP standards with the other units sold separately. I have postings for all other units as well as comprehensive set for student data folders for all 7th grade units.
Please let me know of a
Subjects:
Grades:
7th
Types:
Mean, Median, and Mode - Online Learning Resource
In this product, students are given an interactive Google Doc in which they watch a video and read instructions for the task at hand. With a deck of cards (there is a virtual option on the Google Doc), they will pick the given number of cards randomly from the deck and find the mean, median, mode, and range of the numbers. This allows for randomization as well as student choice.*You can modify this activity by adding more rounds with varying amount of cards to be chosen from the deck.*
Subjects:
Grades:
6th - 9th
Types:
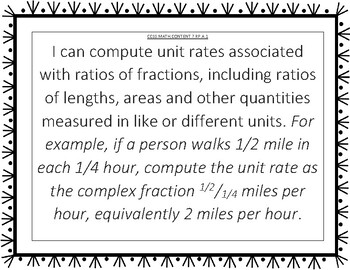
7th Grade Common Core Math State Standards CCSS (Black and White)
These are printable posters for your classroom to display the 7th grade CCSS for math! I personally use these in my classroom to make sure the standards we are working on are always displayed! They are worded in "I can" statements and have the sub standards under each standard.Please share your feedback after downloading!Borders on the forms are from http://www.teacherspayteachers.com/Store/Kims-Creations
Subjects:
Grades:
7th

Hot Heels 4 Mean, mode and coffee
Oops! I got the wobblies!
Year 6,7 and 8 students complete some warm-up exercises calculating mean, median and mode for real results of a real watermelon seed spitting competition with real people. They then use this math to test an Urban Myth about walking with coffee .
The teacher rules here. Wait until the end. You should be the walking with coffee STAR. Of course, students use water.
Subjects:
Grades:
6th - 8th
Types:
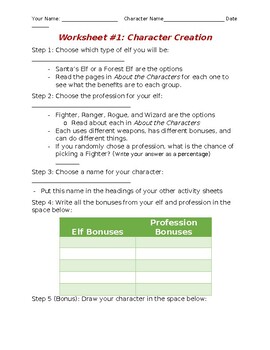
The Elf Wars Worksheet 1 - Character Creation
Worksheet to go with The Elf Wars Probability Game. Part 1 of the lesson is for students to create a character and calculate their attributes.
Subjects:
Grades:
6th - 9th
Also included in: The Elf Wars
Showing 1-18 of 18 results


