8 results
Valentine's Day biology Common Core 7.SP.B.4 resources
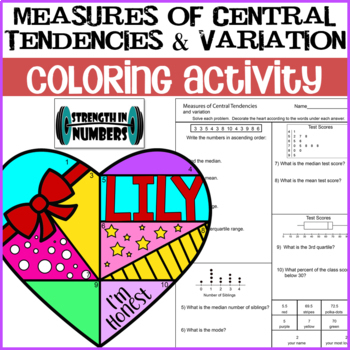
Measures of Central Tendencies & Variation Valentine's Day Coloring Activity
Students will answer 10 data questions including mean, median, mode, range, quartiles, and interquartile range using lists, dot plots, box plots, and stem-and-leaf plots. This worksheet is self checking - answers are at the bottom and students will use the description under the answer to decorate the heart. All my favorite things - colorful, self-checking, and wall-worthy! These are fantastic hung around the classroom for Valentines Day (or anytime your classroom needs a little LOVE) because
Subjects:
Grades:
5th - 8th
Types:
CCSS:

Mean Median Mode Digital Pixel Art Measures of Central Tendency & Center
Take measures of central tendency practice to the next level with pixel art! Students practice finding the mean, median, and mode of different datasets across 3 pixel art activities with 36 problems total. It's a perfect addition to your data & statistics unit.These self-checking Google Sheets give students instant feedback. Incorrect answers are highlighted in red, and correct answers turn green and unlock parts of a mystery picture. They’re easy to assign, keep students engaged, and free u
Subjects:
Grades:
6th - 7th
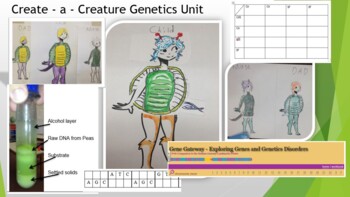
Create - a - Creature Genetics Unit
This whole unit covers the basics of genetics! It includes the Create a Creature lab, home genetic test, Punnet Squares, webquest, and final test!You can also extract DNA from dried peas; practice reading DNA and RNA; explore genetic disorders through the Human Genome Project webquest; and explore pedigree charts! You will have to create your own shell and tail pieces this. The original artist has gone on to draw a Google doodle ! You can also have the students design their own shell / tails. Th
Subjects:
Grades:
7th - 12th, Higher Education, Adult Education
Types:
NGSS:
HS-LS3-3
, HS-LS3-1
, MS-LS4-3
, MS-LS4-1
, HS-LS4-2
...
Also included in: Hands-on Science Semester Labs Bundle
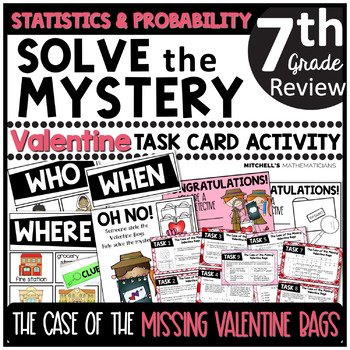
7th Grade Statistics and Probability Solve The Mystery Valentine's Day Task Card
I am excited to share this Valentine's Day MYSTERY CHALLENGE activity with you and your students! You will begin this task card activity by reading a short story that will challenge your students to solve the case of the missing valentine bags. They will have to find out who took them, when they took them, and where they put them. To solve the case, students will work to complete 9 different task cards. The task cards are based on the 7th grade statistics and probability CCSS. Once they complete
Subjects:
Grades:
6th - 8th
Types:

Break Out: Photosynthesis carbon cycle escape room
Photosynthesis break out escape room by Kathy Applebee
Students must use what they know about photosynthesis and the carbon cycle to open the boxes.
Package includes clues, directions, reflection questions and exit ticket, online resources, graphic organizer for data collection of the virtual lab players will need to complete, standards in math and science and editable rubric.
Content area: life science, biology, photosynthesis, plants, botany; Recommended Ages/ target audience: Middle and h
Subjects:
Grades:
7th - 10th
Types:
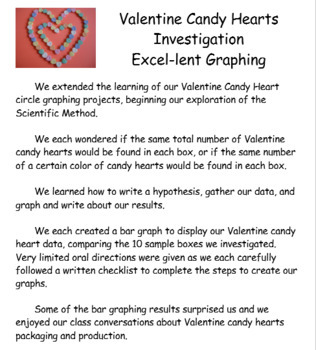
Excel Graphing Valentine Candy Hearts Investigation
#welovecandyheartsThis integrated Math/ Science/ Technology project is a great way to make statistics and probability real, relevant, fun, and delicious!Students will create bar graphs using Excel to display Valentine candy hearts data, as students consider packaging and production of small Valentine candy heart individual boxes. Project file includes sample bulletin board display poster, project directions in individual student checklist form, and rubric to grade the finished graph.Project file
Grades:
5th - 7th
Types:
NGSS:
3-5-ETS1-2
, MS-ETS1-3
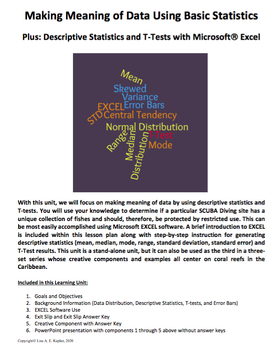
Making Meaning of Data Using Basic Statistics – Plus Statistics with EXCEL
This learning unit includes two files – a PDF document and a PowerPoint presentation. The PDF includes the following components and can be used solely by the teacher or modified to remove the assessment pieces and distributed to the students. 1. Goals and Objectives2. Background Information a. Data Distribution, Descriptive Statistics, T-tests, and Error Barsb. EXCEL Software Use3. Assessmentsa. Exit Slip and Exit Slip Answer Keyb. Creative Component with Answer Key All of the background info
Subjects:
Grades:
7th - 10th
CCSS:
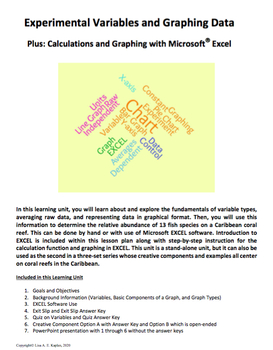
Experimental Variables and Graphing
This learning unit includes two files – a PDF document and a PowerPoint presentation. The PDF includes the following components and can be used solely by the teacher or modified to remove the assessment pieces and distributed to the students. 1. Goals and Objectives2. Background Information a. Variables, Components of a Graph, Graph Typesb. EXCEL Software Use3. Assessmentsa. Exit Slip and Exit Slip Answer Keyb. Quiz on Variables and Answer keyc. Creative Component Options A with Answer Key and
Subjects:
Grades:
7th - 9th
CCSS:
Showing 1-8 of 8 results


