5 results
Valentine's Day graphic arts Common Core 7.SP.B.4 resources

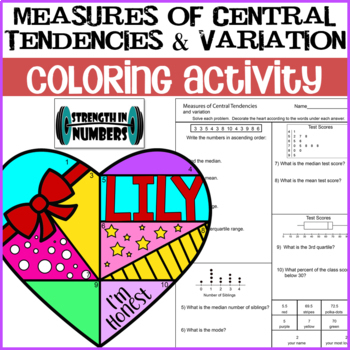
Measures of Central Tendencies & Variation Valentine's Day Coloring Activity
Students will answer 10 data questions including mean, median, mode, range, quartiles, and interquartile range using lists, dot plots, box plots, and stem-and-leaf plots. This worksheet is self checking - answers are at the bottom and students will use the description under the answer to decorate the heart. All my favorite things - colorful, self-checking, and wall-worthy! These are fantastic hung around the classroom for Valentines Day (or anytime your classroom needs a little LOVE) because
Subjects:
Grades:
5th - 8th
Types:
CCSS:

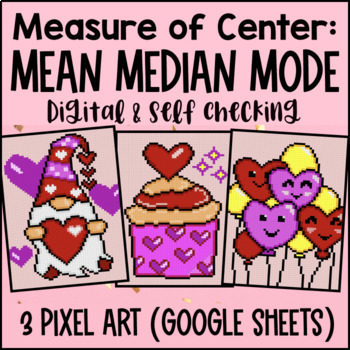
Mean Median Mode Digital Pixel Art Measures of Central Tendency & Center
Take measures of central tendency practice to the next level with pixel art! Students practice finding the mean, median, and mode of different datasets across 3 pixel art activities with 36 problems total. It's a perfect addition to your data & statistics unit.These self-checking Google Sheets give students instant feedback. Incorrect answers are highlighted in red, and correct answers turn green and unlock parts of a mystery picture. They’re easy to assign, keep students engaged, and free u
Subjects:
Grades:
6th - 7th

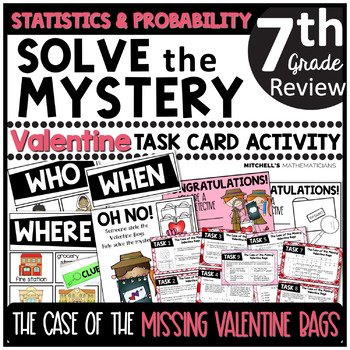
7th Grade Statistics and Probability Solve The Mystery Valentine's Day Task Card
I am excited to share this Valentine's Day MYSTERY CHALLENGE activity with you and your students! You will begin this task card activity by reading a short story that will challenge your students to solve the case of the missing valentine bags. They will have to find out who took them, when they took them, and where they put them. To solve the case, students will work to complete 9 different task cards. The task cards are based on the 7th grade statistics and probability CCSS. Once they complete
Subjects:
Grades:
6th - 8th
Types:

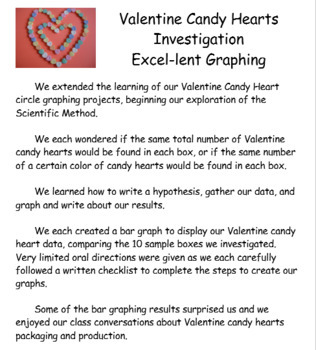
Excel Graphing Valentine Candy Hearts Investigation
#welovecandyheartsThis integrated Math/ Science/ Technology project is a great way to make statistics and probability real, relevant, fun, and delicious!Students will create bar graphs using Excel to display Valentine candy hearts data, as students consider packaging and production of small Valentine candy heart individual boxes. Project file includes sample bulletin board display poster, project directions in individual student checklist form, and rubric to grade the finished graph.Project file
Grades:
5th - 7th
Types:
NGSS:
3-5-ETS1-2
, MS-ETS1-3

Perfect Porridge - Interdisciplinary PBL STEAM Unit
”The Perfect Porridge” is a highly interdisciplinary problem-based learning unit where students apply the Engineering Design Process to breakfast. Students begin with the story of Goldilocks and The Three Bears to consider the connecting idea: What is ‘just right’? Through designing their perfect porridge recipe, students come to understand functionally that considering situations from different perspectives leads to different definitions of a problem and therefore unique solutions. Students
Subjects:
Grades:
6th - 8th
NGSS:
MS-ETS1-2
, MS-PS3-4
, MS-ETS1-4
, MS-PS3-3
, MS-ETS1-1
...
Showing 1-5 of 5 results


