35 results
8th grade statistics workbook pdfs
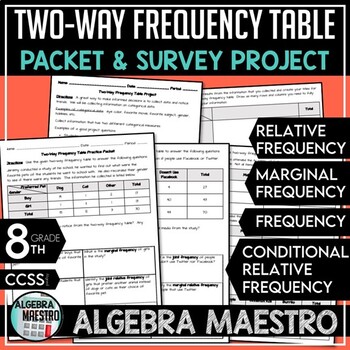
Two-Way Frequency Table Practice Packet & Project
With the Two-Way Frequency Table (or two way tables) Practice Packet & Project you'll receive:-3 pages of student practice via packet-3 pages of the answer key for the packet-2 pages for the student driven projectThe Two-Way Frequency Table Packet and Project are meant to be a review and reinforcement activity. Students can practice and further enhance their understanding using the Packet Practice. Teacher may want to further differentiate the content for advanced students and give them th
Subjects:
Grades:
7th - 12th, Higher Education, Adult Education
Types:
CCSS:
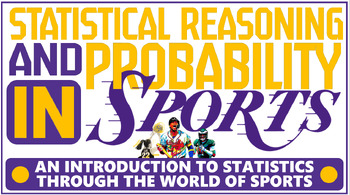
Sports Statistics & Probability curriculum workbook (130+ pages) - Project-based
WATCH THE PREVIEW CLIP! E-MAIL ME FOR DISCOUNTS OR QUESTIONS AT MEDEIROSVINNY@YAHOO.COM.Looking to start an elective math class? Interested in project-based assessments?Tired of teaching statistics with no real-world application?This 139-page interactive workbook serves as a textbook for an introductory statistics math class; complete with Common Core standards crosswalk, embedded answers, and tons of activities and mini-projects. This workbook is the only resource I use for my 'Statistical R
Subjects:
Grades:
8th - 12th
Types:
CCSS:
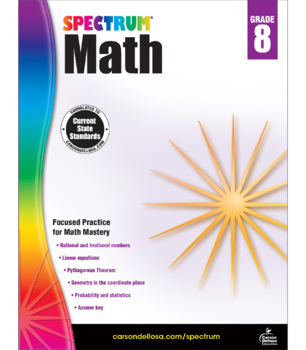
Spectrum Math Workbook Grade 8 Printable 704568-EB
Enhance problem-solving skills and ensure math success with the Spectrum® Math eBook for grade 8!• This 160-page downloadable resource covers rational and irrational numbers, solving equations, and interpreting statistical data.• This teacher-loved series helps kids stay ahead in math by providing systematic and thought-provoking practice designed to increase in complexity.• Keeps kids at the top of their math game using progressive practice, math in everyday settings, and tests to monitor progr
Subjects:
Grades:
8th
Types:
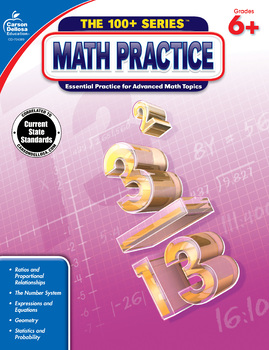
The 100+ Series Math Practice Workbook Grades 6–8 Printable 704389-EB
The 100+ Series Math Practice eBook will challenge your middle school math students with in-depth practice and review! • Includes over 100 targeted practice activities to support standards-based instruction, covering:- ratios and proportional relationships- the number system- expressions and equations- geometry- statistics and probability• Bonus activities on each page help extend learning, making these eBooks perfect for daily review in the classroom or at home. • Your Printable will open in a
Subjects:
Grades:
6th - 8th
Types:
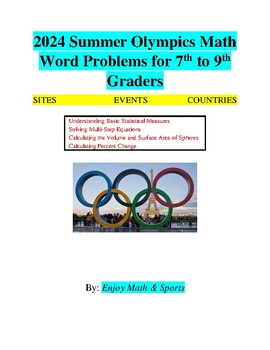
2024 Summer Olympics Math Word Problems for 7th to 9th Graders
Numerous subjects taught in Mathematics are widely used throughout the world of sports. This product presents word problems that show examples of 7th to 9th Grade mathematics subjects that are relevant to the 2024 Summer Olympics. The following subjects are covered:· Understanding Basic Statistical Measures· Solving Multi-Step Equations· Calculating the Volume and Surface Area of Spheres· Calculating Percent ChangeThe product includes introductory materials, 10 detailed examples, and 10 word- pr
Subjects:
Grades:
7th - 10th
Types:
Data Project - Data representation and interpretation
This booklet walks students through the stages of data investigations:
STAGE 1: Deciding on a topic and posing a question
STAGE 2: Collecting raw data
STAGE 3: Graph or Display
STAGE 4: Analyse and Interpret
STAGE 5: Draw conclusion, reflect
The booklet has clear explanations at appropriate stages to support students in the more technical maths such as finding averages.
IF YOU LIKE THIS RESOURCE - PLEASE RATE
Subjects:
Grades:
3rd - 8th
Types:
PPDAC Comparison Investigation Booklet (Box and Whisker)
A resource created to teach students how to use the PPDAC cycle to complete an investigation.Created with the intention of using with Year 9/10 Students in New ZealandThe type of investigation used in this booklet is a relationship investigation.This book includes the following pages:Brainstorming Investigation IdeasWriting Investigation QuestionsWriting a HypothesisWriting a PlanMaking a Box and Whisker PlotAnalysing Box and Whisker Plots (2)ConclusionPractice Mini Investigation
Subjects:
Grades:
7th - 10th
Types:
Also included in: PPDAC Investigation Booklets
PPDAC Relationship Investigation Booklet
A resource created to teach students how to use the PPDAC cycle to complete an investigation.Created with the intention of using with Year 9 Students in New ZealandThe type of investigation used in this booklet is a relationship investigation.This book includes the following pages:Brainstorming Investigation IdeasWriting Investigation QuestionsWriting a HypothesisWriting a PlanCollecting DataMaking ScatterplotsAnalysing Scatterplots (2)ConclusionPractice Mini Investigation
Subjects:
Grades:
7th - 9th
Types:
Also included in: PPDAC Investigation Booklets
mothers day & End of Year Math , 30 Mother's themed math worksheets
Engage Your Students with 30 Mother-Themed Math Problems! Are you ready to ignite your classroom with captivating math challenges? Look no further! This carefully curated set of 30 mother-themed math problems is designed to inspire critical thinking, problem-solving, and mathematical exploration. Whether you’re teaching in-person or virtually, these problems will keep your students engaged and excited about mathematics. Topics Covered: RatioFractionsDecimalsStatisticsLinear EquationsGeometryVo
Subjects:
Grades:
3rd - 12th
Types:
Central Tendency, Scaffolded notes and worksheets, Math 10
This product was originally designed for the British Columbia New Curriculum Workplace Math 10 however it can be used across any curriculum that includes Central Tendency as a topic. Students will learn:· How statistics is a part of their lives· How Central Tendency is connected to statistics· How to calculate:o Rangeo Modeo Mediano Mean (Average)o Understand the influence of Outlierso Critically think about what Average means and when to apply it. Included in this activity are:· 6 pages of not
Subjects:
Grades:
7th - 11th
Types:
Spectrum Critical Thinking for Math Workbook Grade 8 Printable 705120-EB
Apply math skills to everyday life with the Spectrum® Critical Thinking for Math eBook for grade 8!• This 128-page standards-aligned downloadable resource guides children through problem-solving strategies and real-world application with practice in:- integers and exponents - rational and irrational numbers - statistics - linear equations - functions• Improves problem-solving skills with math reasoning questions, tests, word problems, and an answer key.• Your Printable will open in a browser or
Subjects:
Grades:
8th
Types:
Grade 8 Common Core Math Skill Builder BUNDLE!
If you teach 8th Grade Math, then this bundle should be in your files! This bundle contains 31 skill-builder activities and addresses every Grade 8 Common Core mathematics standard. It would work great as an assessment tool for individual lessons, or for standardized test prep. Please send me any feedback or errata notes so that I can modify this document as needed.
Subjects:
Grades:
8th
Types:
Data Analysis- Grade 7- Math Makes Sense 7
This resource is great for class notes or extra practice. The topics included are...-Mean and Mode-Median and Range-The Effects of Outliers -Applications of Averages-Different Ways to Express Probability-Tree DiagramsAnswer key is included.
Subjects:
Grades:
7th - 8th
Types:
Also included in: Grade 7- Math Makes Sense
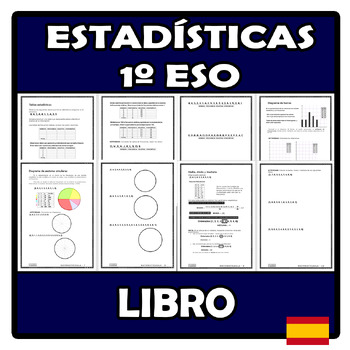
Libro - Estadística 1º ESO
Libro diseñado para trabajar la estadística en 1º ESO.Material listo para imprimir/entregar al alumnado y trabajar en el aula.Contiene solucionario.Índice:Tablas estadísticas Diagrama de barras Diagrama de sectores circulares Media, moda y mediana Rango y desviación media Histogramas Resolución de problemas Please, rate this material if you like it!License Creative Commons:You are free to share — copy and redistribute the material in any medium or format.Under the following terms: Attribution
Subjects:
Grades:
7th - 10th
Types:

Mean, Median, Mode and Range No-Prep Activity Booklet
Filled with five, fun, self-checking activities, this no-prep mean, median, mode and range booklet can be used for lesson consolidation, out-of-class practice or for lesson supervisions. This booklet contains five separate activities:Mean, Median, Mode and Range MazeMean, Median, Mode and Range Pixel Art Colouring Worksheet (can also be purchased separately in store - click here)Mean, Median, Mode and Range Mystery Picture Worksheet (can also be purchased separately in store - click here)Mean, M
Subjects:
Grades:
5th - 8th
Types:
Also included in: ACARA Year 7 Mathematics BUNDLE
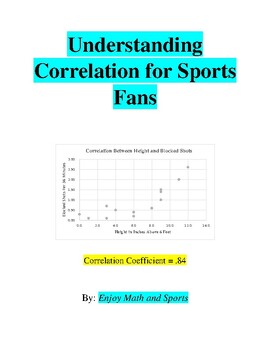
Understanding Correlation for Sports Fans
Correlation describes the relationship between two variables. It is a statistical measure that expresses the extent to which two variables are related in a linear (following a line) fashion. There are many applications of correlation in sports. Studies have been done to explore the correlation between variables such as:· Body composition and sports injuries· Strength training and athletic success· Sports lifestyle and physical health· Playing sports and confidence, body image, academic performan
Subjects:
Grades:
8th - 11th
Types:
CCSS:
Data and Statistics: Student Edition
NOTE: This product is a student workbook and should be used with Data and Statistics: Teaching Edition.In Data and Statistics Using LEGO® Bricks—Student Edition, Dr. Shirley Disseler has developed activities that work to help students learn about data and statistics, using a common toy available in most classrooms and homes—LEGO® bricks! Students learn the basics of representing and interpreting data with line plots, bar graphs, histograms, and box plots. They learn how to measure central tenden
Subjects:
Grades:
5th - 8th
Analyzing Linear Scatter Plots Printable Worksheet, Grade 8
This Worksheet Includes:* Practice questions to help students master Analyzing Linear Scatter Plots * Detailed Answer explanations for every questionPlus access to Online Resources which include:* Additional practice questions* Instructional videos and mobile apps related to the learning objective* Personalized score reports* Instant feedback after completion of the workbook
Subjects:
Grades:
8th
Types:
CCSS:
Also included in: Grade 8 Math - Skills Mastery Bundle Worksheets - Printable Resources
Exploring Yellowstone National Park through Statistical Analysis Workbook
This book contains eight activities that allow students to explore Yellowstone National Park through data collection (online). Each activity focuses on a different statistical skill set. Activities can be used together or as a single activity. The PDF allows for easy reproduction of the pages for student use and provides teacher guidance to set up the activities.
Subjects:
Grades:
7th - 12th, Higher Education, Adult Education
Types:
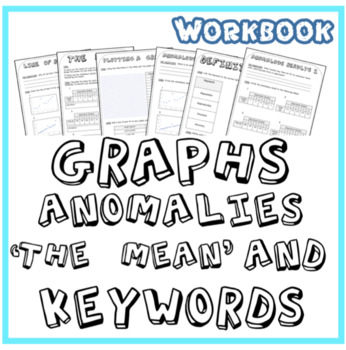
Plotting Graphs in Math and Science (with Means and Anomalies)
This resource is a lesson workbook with questions on:Graph plottingSpotting anomalies in graphs and tablesCalculating the mean of a data setKey definitions (including variables, accuracy, precision etc)Drawing lines of best fitThere is a full answer set for every page of the workbook. The workbook is designed to test how data is manipulated and displayed with an emphasis on spotting trends in data. Please view the preview and feel free to ask any questions before purchase.You may also like:Scien
Subjects:
Grades:
6th - 10th
Types:
Scatter Plots, Line of Best Fit Printable Worksheet, Grade 8
This Worksheet Includes:* Practice questions to help students master Scatter Plots, Line of Best Fit * Detailed Answer explanations for every questionPlus access to Online Resources which include:* Additional practice questions* Instructional videos and mobile apps related to the learning objective* Personalized score reports* Instant feedback after completion of the workbook
Subjects:
Grades:
8th
Types:
CCSS:
Also included in: Grade 8 Math - Skills Mastery Bundle Worksheets - Printable Resources
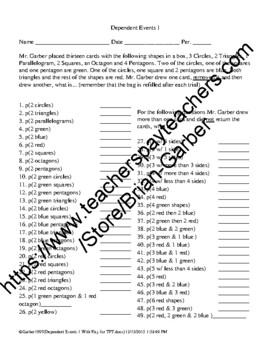
Probability and Dependent Events 1
Problem set for Dependent events. I was always dismayed by the lack of problems sets for probability and so I created a number of sets for my students. While my main focus is psychology I do have a ton of math and statistics stuff… You have managed to find the source of the best Psychology and AP Psychology labs on TPT, go check out my store for other awesome resources, I currently have 498 (3/30/23) different items! These are real labs, you can get your students DOING Psychology! Take a look a
Subjects:
Grades:
7th - 12th
Types:
Interpreting Data Tables & Scatter Plots Printable Worksheet, Grade 8
This Worksheet Includes:* Practice questions to help students master Interpreting Data Tables and Scatter Plots* Detailed Answer explanations for every questionPlus access to Online Resources which include:* Additional practice questions* Instructional videos and mobile apps related to the learning objective* Personalized score reports* Instant feedback after completion of the workbook
Subjects:
Grades:
8th
Types:
CCSS:
Also included in: Grade 8 Math - Skills Mastery Bundle Worksheets - Printable Resources
Statistics Vocabulary
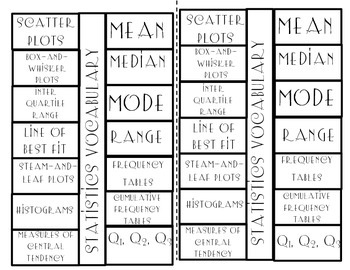
This is a foldable for an Interactive notebook. There is two foldables per a page. Trim out the foldable and cut along the tabs. The only part that is glued is the middle of the foldable (Statistics Vocabulary). If you have any questions please don't hesitate to comment.
Thanks for downloading
Subjects:
Grades:
6th - 12th
Types:
Showing 1-24 of 35 results


