13 results
Graphing workbooks for Microsoft Word
Making Science Charts and Graphs
A simplified look at making charts and organizing data in science.
-Data Charts
-Circle Graphs
-Bar Graphs
-Line Graphs
-Key Vocabulary List
-Quiz/Assessment
-Activity - Practice
-Teacher answer key for quiz and activity
Thanks for taking the time to stop by my store!
Mrs. Degs
Teaching Science Well
Blog: http://teachingsciencewell.wordpress.com/
Facebook: https://www.facebook.com/TeachingScienceWell
TPT: http://www.teacherspayteachers.com/Store/Teaching-Science-Well-Science-Resources
Pi
Subjects:
Grades:
3rd - 10th
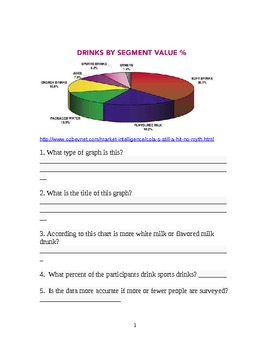
Charts and Graphs for Middle School
Included are thiry-eight graphs, charts, maps, flowcharts, tables and other graphics. These are real data maps taken from the Internet (all sources noted). Under each graphic are five questions that can be answered by using the information provided. The questions range from titles, mean, meadian, to create your own graph.
The pages can be copied back to back to make a workbook. I use this workbook as bellwork while I am taking attendance. Everyday the students answer the question. (I requi
Subjects:
Grades:
6th - 9th
Types:
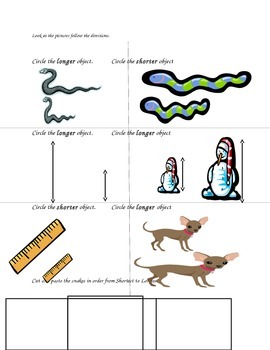
Math Workheets: MEASUREMENT, COMPARING LENGTH, STANDARD UNITS, DATA
These are math worksheets/tests/homework for the Common Core Mathematics Curriculum Grade 1 Module 3. This is good for children who require remediation or have special education needs. It can also be used as extra practice to supplement a math program. The language has been simplified and additional visual cues and examples are given. This set includes:
Lesson 1 through 13 worksheets/exit ticket
Lesson 1 through 13 homework worksheets
End-of-Module Assessment Task
-comparing length
-standard
Subjects:
Grades:
1st
Types:
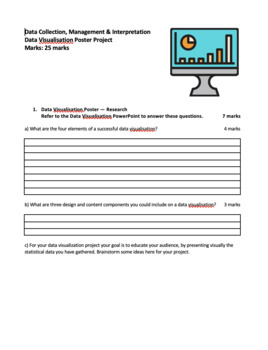
Data Visualisation Poster Project Booklet
This Data Visualisation Poster Project is one of the most successful ways to make boring spreadsheets fun and engaging! It includes questions and step-by-step tasks on research, planning, designing and producing the poster, with recommended marks. It includes links to free software recommendations for producing the poster. It also includes a rubric for the design and producing section.Students will need an introduction to spreadsheets in order to complete the poster project.Best used in conjunct
Grades:
6th - 10th, Higher Education
Types:
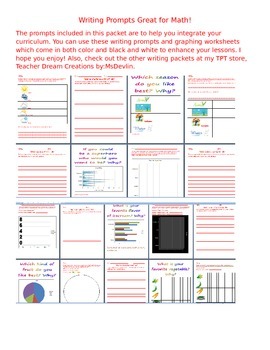
Math Data and Opinion Writing
This 55 page packet includes both colored work and black and white formats. Each set is 3 pages: 1. poster and/or class example of data graph, 2. students graph to write their data plus math comprehension and analysis questions, 3. Student writing assignment. This is a packet your students will sure to love! It is effective and fun!
Grades:
K - 6th
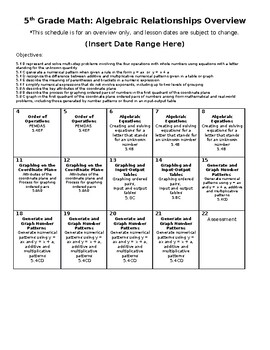
5th Grade Math Algebraic Relationships Complete Unit Lessons and Activities
This is a complete editable booklet with everything you need to teach algebra in 5th grade. Just print one booklet per student. Includes a calendar so parents and students can easily stay on track. Contains 14 days of lesson, notes, guided practice, and independent practice that cover all of the following TEKS and objectives:5.4 B represent and solve multi-step problems involving the four operations with whole numbers using equations with a letter standing for the unknown quantity5.4 C genera
Grades:
5th
Types:
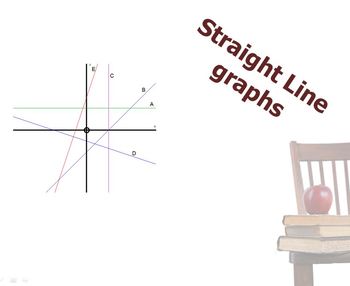
Straight line graphs
This is a very comprehensive resource on how to draw linear functions. It extends the ideas of visual representations of number patterns to linear functions. Learners need to have a basic understanding of plotting points on a Cartesian Plane and determining the formula of a number pattern.
Once learners have worked through this workbook they should have a good grasp of
Drawing straight lines using a table as well as the dual intercept method.
Discrete and continuous data.
Linear and non-linear
Subjects:
Grades:
9th
Types:
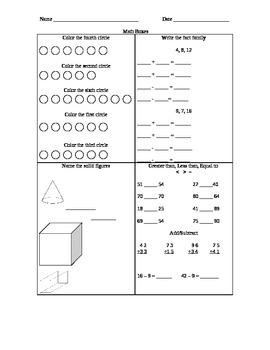
First grade-math common core boxes
These math boxes cover several review of place value blocks, fractions (which I left for you to draw in based on different leveled learners in your classroom), time (also left for you to draw in but I have three choice answers that you may edit as well), fact families, greater than, less than, equal to, ordinal numbers, 3-d shapes, missing addend, adding and subtracting two digit numbers, word problems, related facts, graphing, and making the equation true.
Subjects:
Grades:
1st
Types:
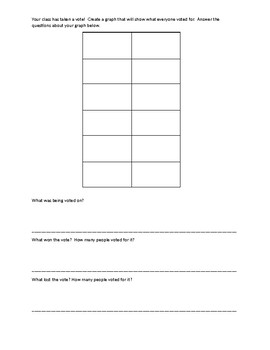
Create and Analyze a Picture Graph
Students will vote on classroom decisions (see voting ballots in my store FREE DOWNLOAD!). Once all of the votes are in, they will create a picture graph to display the results. There are analysis questions to answer once the graph is completed.
For differentiation, picture answers and number cards are included for students who do not write.
Subjects:
Grades:
K - 8th
Types:
Data Collection
An interactive digital notebook that allows students to collaborate to collect data, and then walks them through the process of analyzing their data and creating graphs. This download will give you a link to make a copy of the Google Slide. This activity is great for Google Classroom!
Subjects:
Grades:
4th - 7th
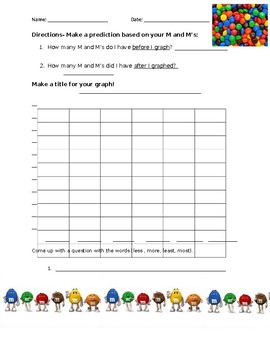
M & M Graphing Worksheet
Want to help students graph? Help them along with a fun treat! Using this graphing worksheet to teach students about bar graphs.
Bottle Flipping Plotting Lines Activity
This goes along with the first half of Module 6 for Grade 5 Engage NY Math Common Core Curriculum. Students use their number of successful bottle flips in 1 minute as a base coordinate pair to create an addition rule from. Students practice creating a table and graphing these coordinate pairs to create a line and compare with another line. There is a challenge for advanced students at the end to help with differentiation within this activity. Activity lasts about 30-40 minutes depending on well
Subjects:
Grades:
5th
Types:
Showing 1-13 of 13 results


