107 results
Graphing scaffolded notes for Microsoft Word
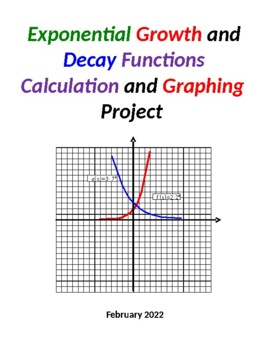
Exponential Growth & Decay Functions Calculation & Graphing Project
PLEASE NOTE: THE PREVIEW VERSION OF THIS PRODUCT IS THE ACTUAL "STUDENT VERSION" AND DOES NOT INCLUDE ANY OF THE ANSWERS TO THE PROBLEMS. THE "PRODUCT VERSION" INCLUDES DETAILED ANSWERS TO ALL OF THE PROBLEMS FOR THE PROJECT.This activity involves the calculation, graphing and coloring of exponential growth and decay functions. I have my Algebra 1/Math 1/Math 2 students complete this project toward the end of the unit on exponential functions.A total of five (5) exponential growth functions a
Subjects:
Grades:
8th - 10th
CCSS:
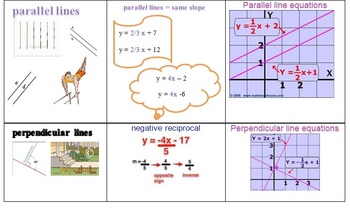
Slope and Intercept Vocabulary and Concept Sheet
Use this vocabulary sheet for Algebra or Geometry students as a reference guide or to introduce the concept of slope and intercept.
Vocabulary:
slope and variable m
rise over run
slope formula
y-intercept/variable b
parallel lines and parallel equation
perpendicular lines and perpendicular equations
negative reciprocal
Subjects:
Grades:
8th - 12th
Types:
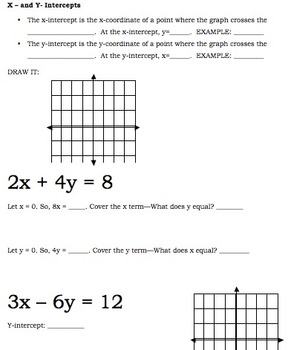
X- and Y-Intercepts and Graphing Guided Notes and Practice
These scaffolded guided notes begin with an introduction to x- and y-intercepts in terms of definition and how to find it. Then the notes go through an example where students can graph the intercepts after they find them. I have four problems that they can do with a partner or in small groups.
Finally, these scaffolded notes end in independent practice that is called "How Hot Can You Handle?" My students are used to this type of practice where they start at the bottom and work their way to the
Grades:
7th - 10th
Types:
CCSS:
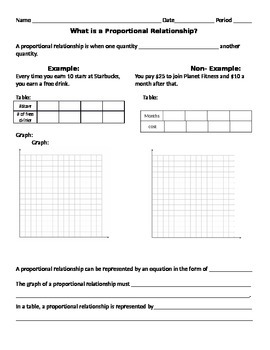
Graphing Proportional Relationships
This is a notes page I used to work through an example and non-example situation that can be represented in a table and a graph. The students had to decide whether or not it was a proportional relationship based on the table and the graph. The students seemed to enjoy it and found it very helpful in their understanding! Would be great for a short review or for a quick introduction!
Subjects:
Grades:
6th - 9th
CCSS:

Concept Comparison: Graphs in Science (Categorical vs Numerical)
How do scientists use graphs? This concept comparison helps students contrast bar graphs, pie charts and line graphs created from categorical and numerical data. The recall device uses DRY MIX and TRAILS as acronyms to help Ss remember how variables are plotted on a graph, and standard format for a graph. The frame comparison helps students contrast rate of change, slope shape and written relationships of functions (y vs. x; y vs. x^2; y vs. 1/x, and so on). THREE (3) activities are included:ha
Subjects:
Grades:
6th - 12th
NGSS:
HS-ETS1-3
, MS-ETS1-3
Also included in: StayGiant Physics Bundle: Measurement
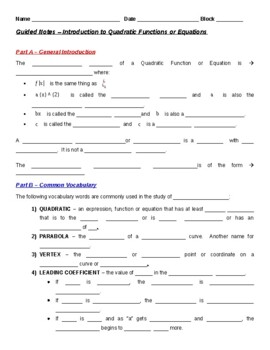
Guided Notes - Introduction to Quadratic Functions (Student/Teacher Versions)
This MS Word file is a Guided Notes document that provides an introduction to quadratic functions/equations. I use it with my regular 8th Grade Math / Math 1 / Math2 / Algebra 1 students immediately after I introduce the concept with my PPT presentation slidepack on the same subject. It is 2 pages of notes for the students to complete. It also includes a graph of a typical quadratic function (parabola) and the students are required to label the key component parts of it. The 2-page companio
Grades:
8th - 11th
CCSS:
Key Features of Quadratic Functions - Notes and Homework
This resource is for the Common Core Algebra I curriculum. It is meant to use to teach key features of quadratic functions. Given a graph or equation of a quadratic function, the key features covered are: opening upward/downard, axis of symmetry, vertex/turning point, maximum/minimum, end behavior, x and y intercepts, intervals where the function is increasing/decreasing, domain/range, and even/odd/neither function. Students are asked to graph the parabola when the equation is given. Note: The
Subjects:
Grades:
8th - 11th
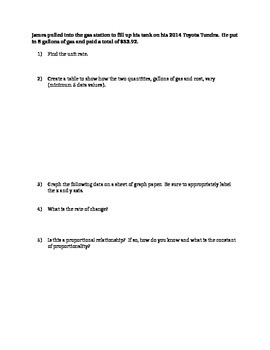
Introduction to Slope - Relating Proportional Relationships
This is to help introduce slope for the first time based on the fact that students have previous knowledge of proportional relationships. It helps them to understand that slope is the same thing as unit rate, the rate of change, and constant of proportionality. They will then brainstorm where slope is used in real life.
I used it in my 8th grade classroom to introduce slope. Previously in 7th grade, students have learned about proportional relationships and mastered the concept of unit rate.
Grades:
7th - 9th
CCSS:
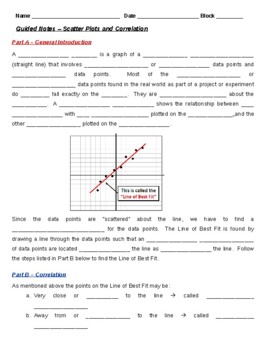
Guided Notes - Scatter Plots and Correlation (Student & Teacher Versions)
This MS Word file is a Guided Notes document that reviews both the concept and steps involved in solving and developing Scatter Plots for linear equations or functions. It also includes a review of Correlation and how to calculated it using a graphing calculator. I use these notes with my Math 1, Math 2 and Algebra 1 students immediately after I introduce this concept with my PPT presentation slidepack on the same subject. It is 3 full pages of notes for the students to complete and includes t
Subjects:
Grades:
8th - 11th
CCSS:

Question Exploration: What Are the Solar Activity Sunspot Cycles?
What are the solar activity sunspot cycles? Sunspots increase and decrease through an average cycle of 11 years. This Question Exploration helps Ss explain how the spotless Sun turns dark, releasing solar flares and coronal mass ejections (CMEs).Question Exploration Routine is an instructional methods that teachers can use to help a diverse student population understand a body of content information by carefully answering a critical question to arrive at a main idea answer. The Concept Comparis
Subjects:
Grades:
7th - 12th, Higher Education
Types:
NGSS:
HS-ESS1-1
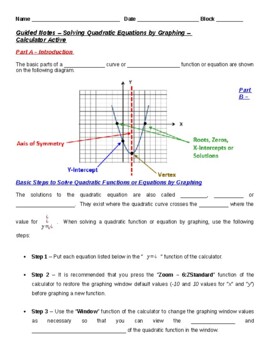
Guided Notes - Solving Quadratic Equations by Graphing (Student & Teacher Ver.)
This MS Word file is a Guided Notes document that reviews both the concept and steps involved in solving quadratic equations by graphing. This Guided Notes document shows the students how to use their graphing calculators to graph a quadratic equation and find the zeros in the calculator. I use these notes with my Math 1, Math 2 and Algebra 1 students immediately after I introduce this concept with my PPT presentation slidepack on the same subject. It is 2 pages of notes for the students to c
Grades:
8th - 11th
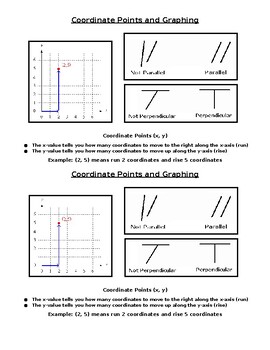
Coordinate Points and Graphing
Editable! Scaffolded notes that show how to read coordinate points and what the x and y points and axis show you.
Subjects:
Grades:
4th - 6th
Types:
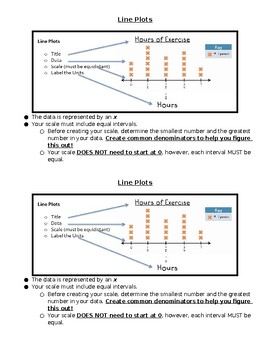
Line Plots Scaffolded Notes
Editable! Scaffolded notes on how to read a line plot.
Subjects:
Grades:
3rd - 6th
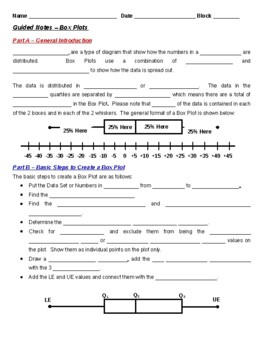
Guided Notes - Box Plots (Student & Teacher Versions)
This MS Word file is a Guided Notes document that reviews both the concept and steps involved in solving and producing Box Plots. I use these notes with my Math 1, Math 2 and Algebra 1 students immediately after I introduce this concept with my PPT presentation slidepack on the same subject. It is 2 full pages of notes for the students to complete and includes the detailed steps that I teach my students to use to solve and produce Box Plots. The 3rd page includes an example problem that is wo
Subjects:
Grades:
8th - 10th
CCSS:

Graphing Linear Equations in Point-Slope and Standard Form Notes
These guided notes will help introduce graphing equations of lines and both point-slope and standard-form. There are a few examples with different circumstances to try with your students. This is completely editable so you can change font size, spacing, or even examples as you need.Please see a separate product listing for the Answer key! It is still free.
Grades:
6th - 12th
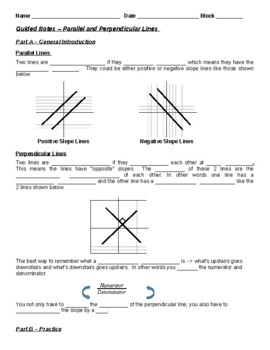
Guided Notes - Parallel and Perpendicular Lines (Student & Teacher Versions)
This MS Word file is a Guided Notes document that covers the concept of Solving and Graphing Parallel and Perpendicular Lines. I use it with my regular 8th Grade Math / Math 1 / Algebra 1 students immediately after I introduce the concept with my PPT presentation slidepack on the same subject. It is a total of 2 pages of notes for the students to fill in with 2 parallel vs. perpendicular line problems included on the last page for the students to solve. The companion, 2-page teacher answer ke
Grades:
8th - 10th
CCSS:
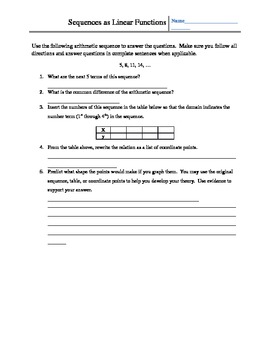
Sequences as Functions
11 Questions starting from basic arithmetic sequence to probing about the comparisons between the sequence and the graph it forms. The questions lead students to graphing and writing the equation of this arithmetic sequence. This is easily an activity that students can try on their own and make connections with on their own as long as they have experience interpreting graphs and understand how to use slope-intercept form.
Subjects:
Grades:
7th - 9th
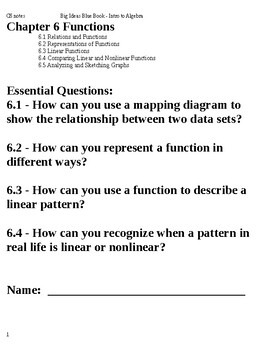
Intro to Algebra: Big Ideas Blue Book Chapter 6 - Algebra Functions
A perfect companion of guided notes for the Big Ideas: Blue Book (Intro to Algebra). These are scaffolded notes that have explicit directions. A template for students to use to take class notes based on the exercises in the Big Ideas Math Blue Book (8th Grade curriculum) Chapter 6-Functions. You can use the .pdf on a Smart Board or projector to guide students, work out problems, and model how to fill in the notes from the text. Also, plenty of bonus materials included within: Step by step worked
Grades:
7th - 10th
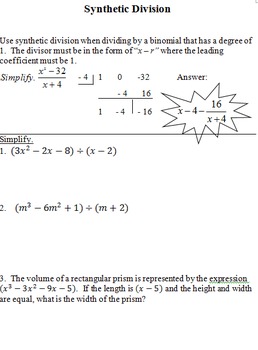
Polynomial Functions Guided Notes
Guided Notes on the basics of Polynomial Functions
Math 3 Common Core
Topics include...
Fundamental Theorem of Algebra
Ending Behavior of Polynomial Functions
Sketching Cubic and Quartic Functions
Maximum Volume
Synthetic Division
Remainder Theorem
These notes are intended to be lectured and worked through as a class. I then use Infinite Algebra to make worksheets based on my classroom's abilities.
For use in Math 3 and possibly advanced Math 2 classrooms!
Subjects:
Grades:
10th - 12th
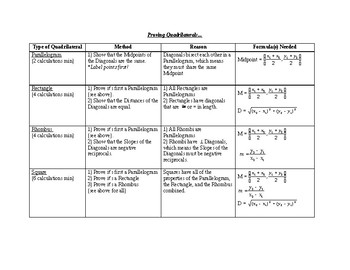
Proving Quadrilaterals on the Coordinate Plane
This is a graphic organizer I use to prove algebraically the various types of quadrilaterals on the coordinate plane.
There's two graphic organizers--one is filled out completely, the other is partially filled out. This provides opportunities for differentiating to meet the needs of diverse learners.
Grades:
9th - 11th
CCSS:
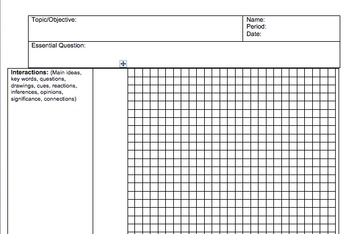
Cornell Notes for Graphing - Math/Science (editable)
Similar in design to my free Cornell Notes template, this template includes 2 pages for graphing and taking notes on it. The right side of both pages is graph paper with room for labels and increments and the left side is room for notes and prompts for students to reflect on their graphs. The document is compatible with word and able to be edited to reflect specific needs you may have.
Grades:
3rd - 12th, Higher Education, Adult Education
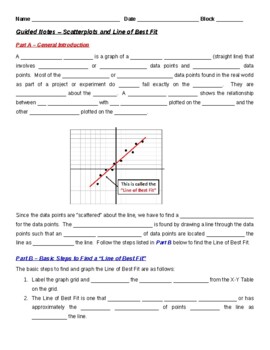
Guided Notes - Scatterplots and Line of Best Fit (Teacher & Student Versions)
This MS Word file is a Guided Notes document that reviews both the concept and steps involved in solving and developing Scatter Plots and Lines of Best Fit for linear equations or functions. I use these notes with my Math 1, Math 2 and Algebra 1 students immediately after I introduce this concept with my PPT presentation slidepack on the same subject. It is 3 full pages of notes for the students to complete and includes the detailed steps that I teach my students to use to develop and graph a
Subjects:
Grades:
8th - 10th
CCSS:

Methods for Solving Quadratic Functions
The worksheets cover how to solve quadratic functions by graphing, using square roots, factoring, the quadratic formula, and completing the square. These can be used as notes and practice, or just as practice. If all pages are printed off at once, they can be turned into a book that the students can use for notes and keep to study from. The second sheet in the book can be used as a "cheat sheet" that students create to remember each of the methods. When using this in my classroom, I created
Subjects:
Grades:
9th - 12th
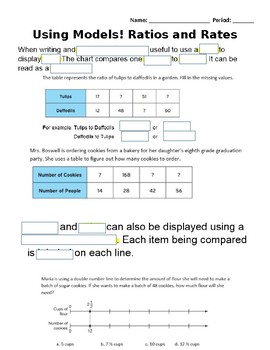
Using Models to Represent Ratios, Rates and Unit Rates Scaffold Notes
Students will use these fill in the blank notes to guide them through the Smartboard lesson on Models for ratios, rates and unit rates (located in store). Each page of the lesson is a screen shot with missing words. Students will fill in the blank and answer practice problems on handout. There is a lot an answer doc with the missing words filled in for any students with accommodations.
Subjects:
Grades:
5th - 7th
Showing 1-24 of 107 results


