584 results
8th grade graphing scaffolded note pdfs
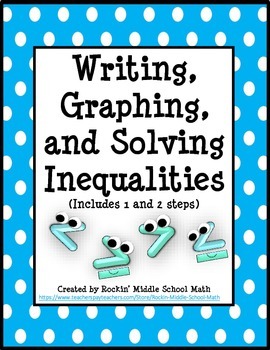
Writing, Solving, and Graphing Inequalities - 6.EE.B.5 and 7.EE.B.4.b
This contains 4 different activities that will teach your students all about writing, solving, and graphing inequalities and includes real world problems. There is two sets of interactive guided notes that can be done together and have plenty of practice examples. There is two sets of practice worksheets that students can complete in class or for homework. I have included both 1 and 2 step inequalities. Students will need to already be familiar with solving equations to solve the inequalities
Subjects:
Grades:
6th - 9th
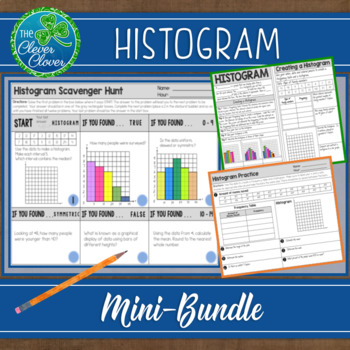
Histogram - Notes, Practice Worksheets and Scavenger Hunt
This histogram resource includes guided notes, a practice worksheet and a scavenger hunt. Your students will have the opportunity to create, interpret and discuss histograms. Below, you will find a detailed description of the notes, worksheet and scavenger hunt. Guided NotesThere are two small pages of guided notes. The first page provides the definition of a histogram and step by step instructions on how to create a histogram. The bottom portion of the notes has students examine three types (un
Subjects:
Grades:
6th - 9th, Adult Education
CCSS:
Also included in: Statistics Bundle - Guided Notes, Worksheets & Scavenger Hunts!
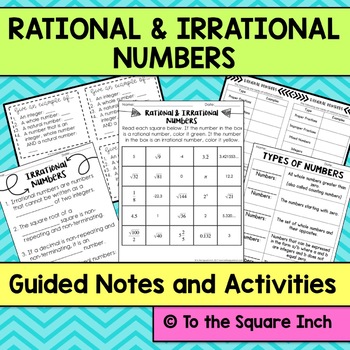
Introduction to Rational and Irrational Numbers Interactive Notebook
Introduction to Rational and Irrational Numbers, Guided Notes and Interactive Math Notebook PagesCommon Core Standard 8.NS.A.1Digital version of this product can be found here.Included in this product: Types of Numbers Notes (Full and half page notes)Types of Numbers FoldableGive an example cards (can be used as exit or entrance slip) Rational Numbers NotesIrrational Numbers NotesRational or Irrational Practice with guiding questionsRational and Irrational Numbers cut-and-paste sortRational and
Grades:
7th - 10th
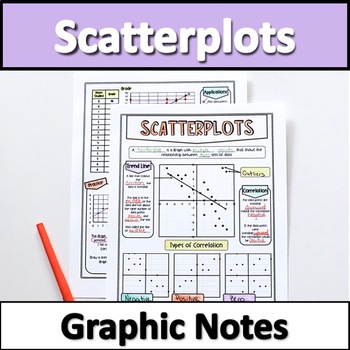
Scatter Plots Graphic Notes
Looking for an engaging way to teach scatter plots? These graphic notes are perfect for student engagement and can double as classroom posters!These content rich, beautiful notes serve as a great introduction to your unit and work wonderfully as a quick-reference for students. Material Covered: trend lines/line of best fit, outliers, types of correlation (positive, negative, zero), creating & interpreting scatter plots and trend lines. This Product Includes1 Page of Key Features Scatter P
Grades:
8th
Types:
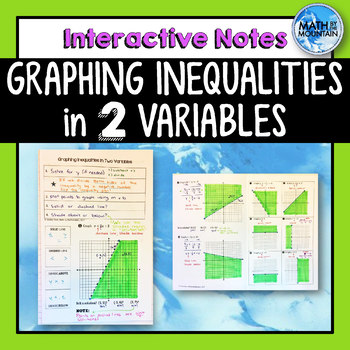
Graphing Linear Inequalities in 2 Variables Interactive Notebook Notes
These notes are perfect for an interactive notebook (INB) and are built to reinforce prior concepts. Help your students see the process graphing inequalities in two variables on the coordinate plane. Explore the special cases of vertical and horizontal inequalities! In some examples, students must solve for y prior to graphing, which is a fantastic review of (1) rerwriting equations, (2) remembering the flip the sign, and (3) identifying slope and y-intercept! The front page of these notes are
Subjects:
Grades:
6th - 10th
CCSS:
Also included in: Unit 7 - Systems of Equations & Inequalities - Interactive Notebook Kit
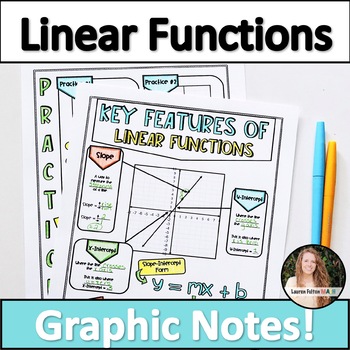
Key Features of Linear Functions Notes | Graphing Linear Equations
Looking for an engaging way to teach key features of linear functions in slope-intercept form? These graphic notes are perfect for student engagement and can double as classroom posters!These content rich, beautiful notes serve as a great introduction to your unit and work wonderfully as a quick-reference for students. Material Covered: Slope from graphs, y-intercept, x-intercept, slope-intercept form, horizontal lines, parent function, and vertical lines. This Product Includes1 Page of Key Feat
Grades:
8th - 9th
Types:
CCSS:
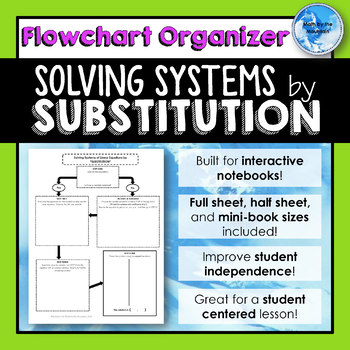
Solving Systems of Equations by SUBSTITUTION *Flowchart* Graphic Organizers
Help your students visualize the solving process for the substitution method of solving systems of linear equations. Students are able to easily lead themselves or others through a problem, even if it is their first time using this method. Includes*Solving by Substitution Flowchart Graphic Organizer (half-sheet size)*Solving by Substitution Flowchart Graphic Organizer (full-sheet size)*Solving by Substitution Flowchart Graphic Organizer (mini-book size)Half sheets and mini-books are great for in
Grades:
7th - 12th
CCSS:
Also included in: Systems of Equations *Flowchart* Graphic Organizers BUNDLE
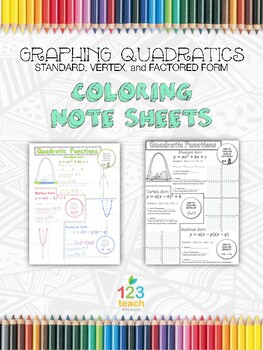
Graphing all Three Forms of Quadratic Functions Coloring Note Sheets
Many high school students still enjoy coloring and doodle notes! Use these Graphing Quadratic Functions in Standard form, Vertex form, and Factored Form Coloring Note Sheets (or Doodle Notes) for an engaging, FUN note activity / graphic organizer / review in your high school math classroom.This coloring note sheet can be used for a guided lesson, as an assignment, review activity, or as a study guide. Students fill in the blanks, complete practice problems, and spend some extra time reviewing
Grades:
8th - 11th
CCSS:
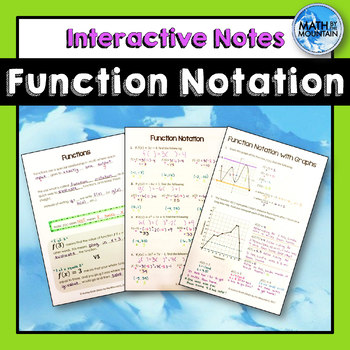
Function Notation Interactive Notebook Notes
Help your students learn how to read, interpret, and evaluate function notation from equations, graphs, and tables. These notes offer a great blend of representations and different levels of rigor to meet the needs of all of the learners in your classroom. THREE resources are included:A reference half-sheet that discusses the difference in function notation meanings to clear up common misconceptions. A mini-book set of notes that covers algabraic representations of function notation. A mini-book
Subjects:
Grades:
8th - 11th
CCSS:
Also included in: Functions, Relations, and Domain and Range BUNDLE
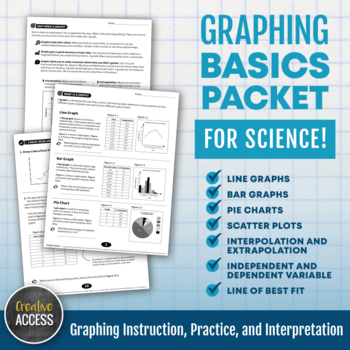
Science Graphing Basics Packet: Line Graph, Bar Graph, Pie Chart, Scatter Plot
This no-prep 10-page packet provides graphing instruction, practice, and interpretation for your middle and high school science students. Topics include line graphs, bar graphs, pie charts, scatter plots, extrapolation/interpolation, line of best fit, graphing labels, and independent/dependent variables.Each page is packed with information, graphs, examples, and frequent check-your-understanding questions. Choose to complete the packet as a whole class, in stations, in groups/partners, or as an
Subjects:
Grades:
7th - 12th
Also included in: Mega Bundle of No-Prep and Low-Prep Secondary Science Sub Plans

Solving Systems of Equations by ELIMINATION *Flowchart* Graphic Organizers
Help your students visualize the solving process for the elimination method of solving systems of linear equations. Students are able to easily lead themselves or others through a problem, even if it is their first time using this method. Includes*Solving by Elimination Flowchart Graphic Organizer (half-sheet size)*Solving by Elimination Flowchart Graphic Organizer (full-sheet size)*Solving by Elimination Flowchart Graphic Organizer (mini-book size)Half sheets and mini-books are great for intera
Grades:
7th - 12th
CCSS:
Also included in: Systems of Equations *Flowchart* Graphic Organizers BUNDLE
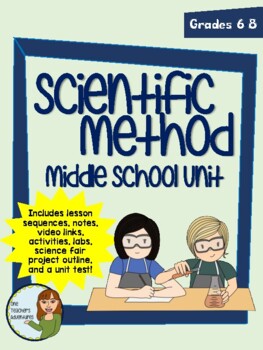
Middle School Scientific Method Unit - Notes, Labs, Activities, Test
This 70-page unit includes 7 lessons taking place over 4-5 weeks to teach your middle school students about the scientific method. Each lesson includes teaching notes, links to any supplemental materials (notes slideshows, videos, etc.), and student materials (notes, activities, labs, project outline, test, etc.). This includes two full labs, 3 sets of scaffolded notes, 9 classroom activities, a science fair project, and a unit test.Lesson 1 - Introduction to the Scientific Method activity - stu
Subjects:
Grades:
6th - 8th
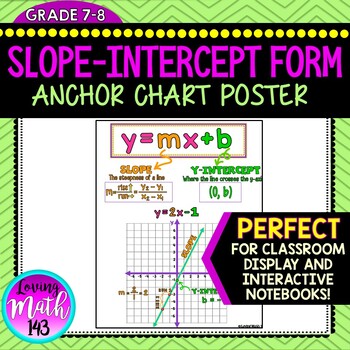
Slope-Intercept Form Anchor Chart Poster (y = mx+b)
Middle School math students can enjoy this visual representation of the slope-intercept form on a graph. Students will see the relationship between the equation, the line, and points on the graph. Students can calculate the slope using "rise-over-run" and apply the formula (change in y over change in x) Both slope and y-intercept are defined and labeled on this perfect anchor chart poster. This poster makes for great classroom poster, anchor chart, reference sheet classroom scaffold/tool.*******
Grades:
7th - 8th

Types of Solutions to Systems of Equations Foldable
This foldable covers the three types of solutions to a linear system of equations. Each of the three flaps includes an example of what a system with that type of solution would look like, how the slopes and y-intercepts are related to produce the given number of solutions, and an example asking students to apply the new information. This foldable is perfect for a standalone lesson, review at the end of a unit, part of a stations activity, or homework! This foldable was made to go with my How Man
Subjects:
Grades:
8th - 11th
CCSS:
Also included in: Unit 7 - Systems of Equations & Inequalities - Interactive Notebook Kit
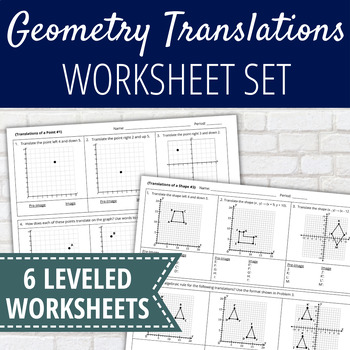
Scaffolded Geometry Translations Worksheet
Looking for a differentiated geometry translations worksheet set? This scaffolded worksheet set will help student dive deep into understanding rather than mimicry.⭐This resource includes⭐Lesson plan instructionsScaffolded Translation Worksheets (Includes 6)Answer Keys✨How This Set Works✨Within the 6 worksheets, there are 2 sections:Translation of a PointTranslation of a ShapeEach worksheet serves a unique purpose. Worksheet 1 & 4 do not use algebraic notation. This is perfect for students wo
Grades:
8th - 9th
Also included in: Scaffolded Geometric Transformations Unit and Activities
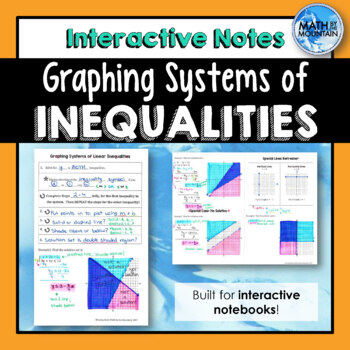
Solving Systems of Inequalities by Graphing Interactive Notebook Notes
This set of solving systems of inequalities by graphing problems comes complete with 4 examples, plus a refresher on how to graph vertical and horizontal lines! These notes are perfect for an interactive notebook (INB) and are built to reinforce prior concepts. Help your students see the process behind solving a system of linear inequalities. Explore the special case of having no solution as well as graphing with horizontal and vertical lines.All examples have been thoughtfully chosen to generat
Subjects:
Grades:
6th - 12th
CCSS:
Also included in: Unit 7 - Systems of Equations & Inequalities - Interactive Notebook Kit
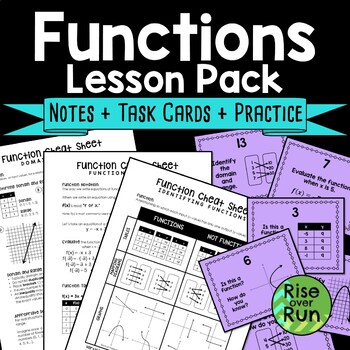
Identifying Functions Guided Notes, Practice, and Worksheets
Help your students identify functions, use function notation, and identify domain & range with these notes and practice activities. Students work with graphs, tables, mapping diagrams, equations, and sets of ordered pairs.Here's what's included:Function Cheat Sheets/Guided Notes: These pages help students identify functions, use function notation, and identify domain and range. Give the cheat sheets as references or use the guided notes format with blanks for students to fill in.Task Cards:
Grades:
8th - 9th
CCSS:
Also included in: Identifying Functions Unit with Activities, Notes, Practice, and Test
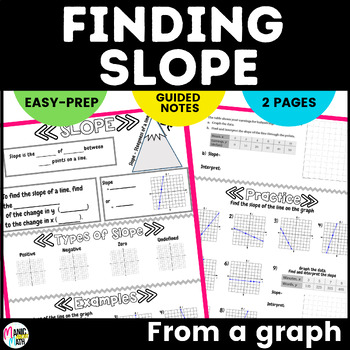
Finding Slope From A Graph Sketch Notes & Practice
Are you looking to engage your middle school math students during note taking? By using these sketch notes to teach finding slope from a graph your students are sure to be more engaged and retain more information! These notes introduce students to the four different types of slope, how to find slope from a graph, and allow for plenty of practice with this topic.This activity is perfect for middle school and can be used to introduce this topic, as a refresher, or as homework. These notes also all
Grades:
7th - 8th
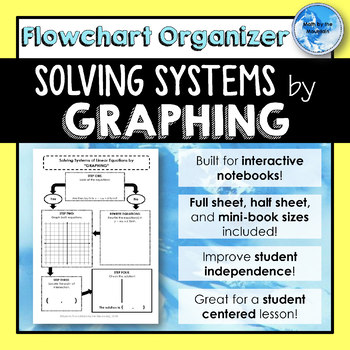
Solving Systems of Linear Equations by GRAPHING *Flowchart* Graphic Organizers
Help your students visualize the solving process for the graphing method of solving systems of linear equations. Students are able to easily lead themselves or others through a problem, even if it is their first time using this method. Includes*Solving by Graphing Flowchart Graphic Organizer (half-sheet size)*Solving by Graphing Flowchart Graphic Organizer (full-sheet size)*Solving by Graphing Flowchart Graphic Organizer (mini-book size)Half sheets and mini-books are great for interactive note
Grades:
7th - 12th
CCSS:
Also included in: Systems of Equations *Flowchart* Graphic Organizers BUNDLE
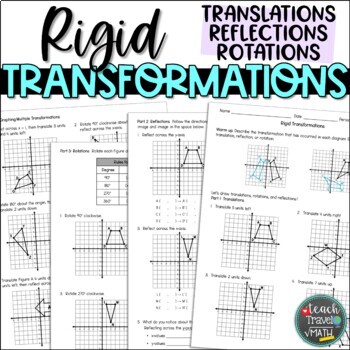
Rigid Transformations: Translations, Reflections, Rotations
Translations, Reflections and Rotations OH MY!Help students discover and understand rigid transformations in this four part activity. Over the course of 20 questions students practice translating, reflecting, and rotating geometric figures in the coordinate plane. On the last page there are multiple-step transformations to bring it all together. When reflecting about the x and y-axis, students are asked to look for patterns and write a rule. For rotations, the rules are given and students may
Grades:
8th - 10th
Also included in: Transformations Bundle

Finding X and Y Intercepts Foldable
This foldable provides students with an introduction to what x- and y-intercepts are, as well as 6 example problems that cover finding x- and y-intercepts from graphs, tables, and linear equations. This foldable is perfect for a standalone lesson but also makes a great review or homework assignment! This foldable has been set up in a way that makes it easy to visually show the connections between finding the x- and y-intercepts from the various representations. Are you looking for other foldabl
Grades:
7th - 10th
CCSS:
Also included in: Unit 5 - Linear Functions & Slope - Interactive Notebook Kit
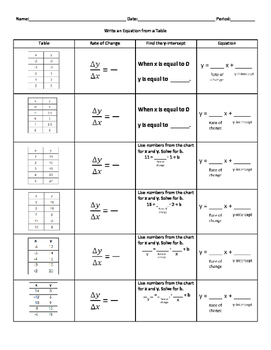
TEKS 7.7A Writing a Linear Equation from a Table
This is a guided practice page intended for students to learn to be comfortable finding the y-intercept and the rate of change/slope in order to write an equation in the form y=mx+b. It gradually releases students to fill in information on their own and increases in complexity throughout.
Grades:
7th - 9th
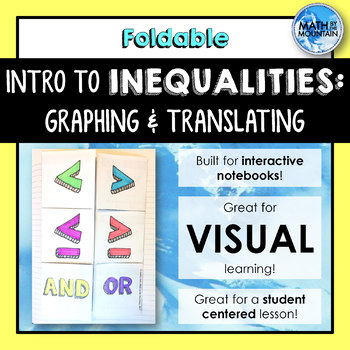
Intro to Inequalities - Graphing and Translating Foldable
This intro to inequalities foldable covers a brief introduction to graphing inequalities in one variable. Students learn whether to use an open or a closed point, and keywords that translate to the various inequalities. Each of the four inequality symbols are included, as well as compound "and" and "or" inequalities. Two different font options are included for the front flaps of the foldable. This foldable is perfect for a standalone lesson, review at the end of a unit, part of a stations act
Grades:
6th - 9th
CCSS:
Also included in: Unit 3 - Solving Multi-Step Inequalities - Interactive Notebook Kit
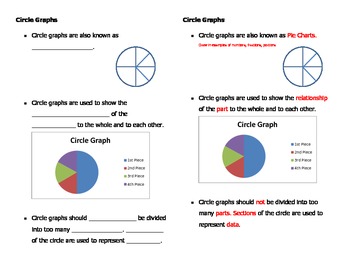
Construct, Compare, Interpret Circle Graphs
Mini Unit: Circle graphs are studied through several guided lessons and independent practice worksheets. Guided notes examine circle graphs and the types of data they represent and are perfect for your interactive notebook. Graphs are constructed to and from a bar graph. Problems involve evaluating and interpreting data through the percents, portions, and fractions represented by graphs. For use in upper elementary and middle school exceptional and general education classrooms.
Subjects:
Grades:
4th - 9th
Showing 1-24 of 584 results


