22 results
Graphing interactive notebooks for SMART Notebook
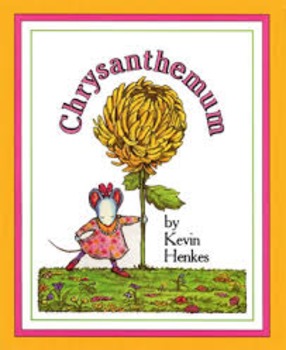
Chrysanthemum Name Graph
An interactive name graph for your students to compare the length of their name to their classmates.
Subjects:
Grades:
K - 2nd

March Lion and Lamb Graph for the Smart Board
Teachers and students can keep track of the weather in March (Did it "Roar in like a lion and out like a lamb...") with this interactive smart board slide. Students can make predeictions and also use the data to answer mathmatical questions about the graph (most/least/how many more etc).
There is also a March Poem included for discussion and shared reading.
Subjects:
Grades:
K - 2nd
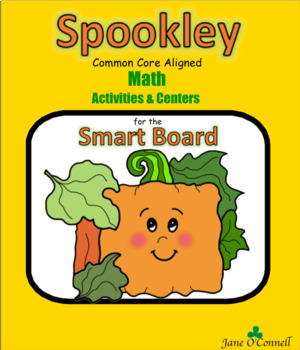
Spookley Math Centers & Activities for the Smart Board
This is a 45 page product for the Smart Board. It is a Common Core Aligned product that can be saved as a printable pdf. to accompany the lessons or centers.It features the popular and familiar character Spookley the Square Pumpkin.The product contains:-comparing numbers 1-10 using Spookley and other pumpkins for the story-an audio component that has a farmer "speaking" and asking for a particular amount of pumpkins into a ten-frame-graphing pumpkins from the story-sorting pumpkins by shape and
Subjects:
Grades:
PreK - 1st
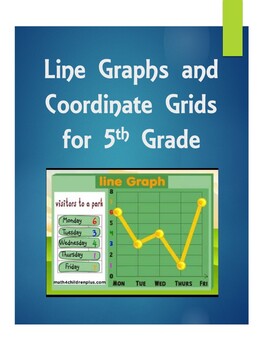
Line Graphs and Coordinate Grids for 5th Grade
Use this interactive Smart Notebook file to introduce your students to the vocabulary and parts of a coordinate grid. Activities include vocabulary review with dice, ideas for creating a line graph, plotting points on coordinate grids, and websites to use for practice in a whole group setting.
Grades:
5th - 6th
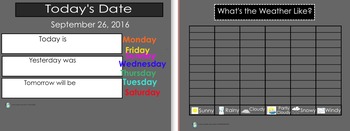
Interactive Morning Calendar
This smartboard calendar is a great way to include your students during calendar time.
This calendar includes:
- colors
- shapes (3d and flat)
- graphs (tracking the weather)
- song links (weather and days of the week)
- tens and ones
- tally marks
- tens frames
- counting by 5's and 10's
- counting to 10 by 1's
- counting to 20 by 1's
- counting to 50 by 1's
- representing numbers
- fact families
- days of the week (what was yesterday, today, and tomorrow)
- number bonds
- one more, one less
Subjects:
Grades:
PreK - 3rd
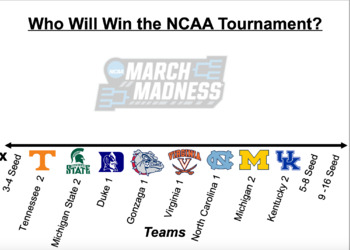
NCAA March Madness 2019 Smart Notebook Line Plot
This product is an interactive line plot using Smart Notebook software. You must have access to Smart Notebook and/or be able to access Smart Notebook Express online in order to utilize this product!Students can use this line plot to vote on the team they think is going to win the NCAA tournament! You can use this product to discuss probability and also to reinforce the skill of line plotting.
Subjects:
Grades:
Not Grade Specific

Table of Values
In this lesson, students will learn how to graph anything using a table of values. The lesson begins with an example, then goes through an activity where pairs will graph all of the functions learned in PreCalculus 30. Students will then take part in assessing the answers with the graphs provided in the document. This is how I start my PreCalculus courses every year, and it is very helpful.This lesson is also available as a PowerPoint.Enjoy!
Subjects:
Grades:
10th - 12th
Also included in: PRECALCULUS 30 BUNDLE - ALL OF IT!
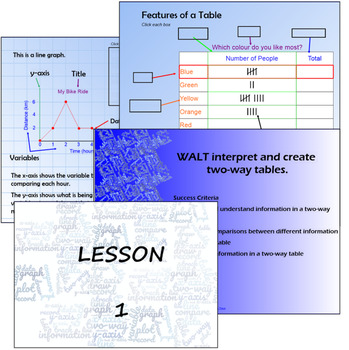
Data Lesson Sequence - 4 Lessons - Data/Statistics - KS2/Stage 3
Data lessons on tables, two-way tables and line graphs presented in Smart Notebook. It includes 4 lesson presentations including WALTs and Success Criteria in the slides, all ready to be used with your class. It gives some basics for a unit of work on data and it is fully editable. The aim of these lessons is to break down each data collection/displaying method into simple language so that it is easy to follow.Lesson 1 - Simple Data Tables. This goes through the features of a table and practice
Subjects:
Grades:
4th - 7th
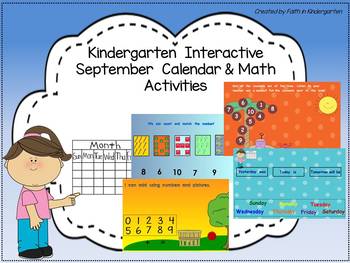
Kindergarten Interactive September Calendar and Math Activities
This is an interactive September calendar created with SMART Notebook. You must have SMART Notebook installed to use this product.
These math activities are designed to get your students excited about participating in "calendar" everyday! With these math activities students are exposed to the different math standards daily.
Slides include: graphing, counting and cardinality, number identification, addition and subtraction, 100 charts, comparing numbers, geometry, ten frames and problem sol
Subjects:
Grades:
PreK - 1st
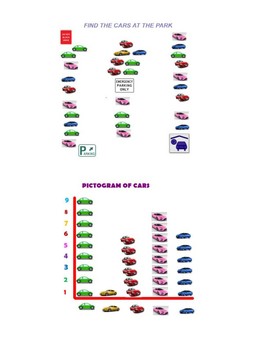
DATA HANDLING
These set of activities will help you to gather data by counting, record the data and lastly present data using pictogram.
Grades:
1st - 3rd
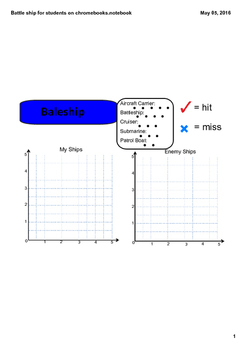
Grade 5 Math Module 4 lesson 4 Battleship -Student Use
This smartnotebook file is meant to use on individual ipads or chromebooks on smarttech express. The infinate cloner on the smart notebook file allows students to do this lesson electronically very easily with a laptop, tablet, etc.
Grades:
5th - 6th
Types:
CCSS:
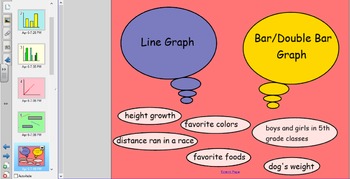
Line/Bar/Double Bar Graph Smart Notebook
This is a Smart Notebook lesson on line graphs, bar graphs, and double graphs for 5th grade.
Subjects:
Grades:
5th

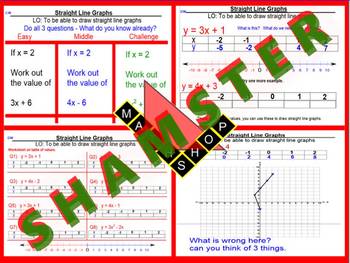
An Introduction to Graphing Lines Using Slope and Y-Intercept- Grade 8 or 9
This smart notebook lesson introduces graphing lines using the slope and y-intercept. There are 16 total practice problems. The first few involve graphing with a table of values. The next few involve graphing by stating and using the slope and y-intercept. I have my students write the slope as a fraction with directions (ex: up or down/right or left) for each question when they are first learning this concept. I would print out the slides and have your students do the same. There are also
Grades:
8th - 9th
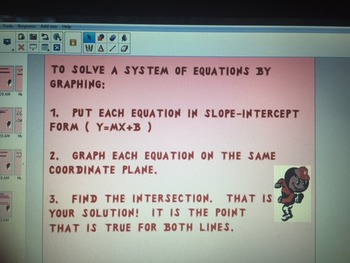
Solving Systems of Equations by Graphing
Students will solve systems of equations by graphing.
Subjects:
Grades:
8th
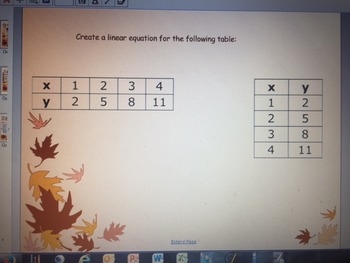
Different Representations of Linear Functions
Given a table, graph, context, or equation, students will find the other representations of the function.
Subjects:
Grades:
8th
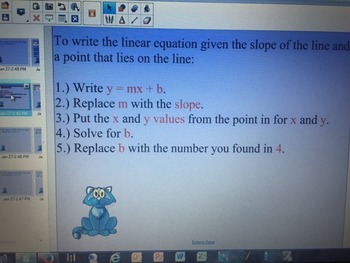
Write a Linear Equation Given a Point and the Slope or Given Two Points
Students will be able to write a linear equation given a point on the line and the slope or given two points on the line.
Grades:
8th
CCSS:
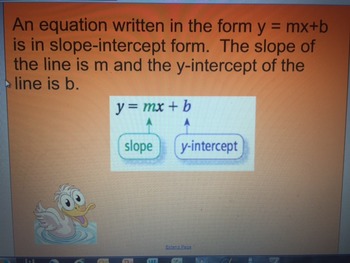
Graphing a Linear Function Given Slope-Intercept Form
Students will graph equations in slope intercept form.
Grades:
8th
CCSS:
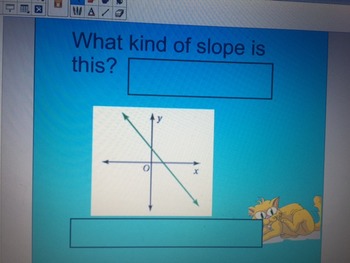
Slope
Students will be able to identify if the slope of a line is positive, negative, zero, or no slope. They will also be able to find the slope of the line. Lastly, students will be able to use the slope to answer questions in context.
Grades:
8th
CCSS:
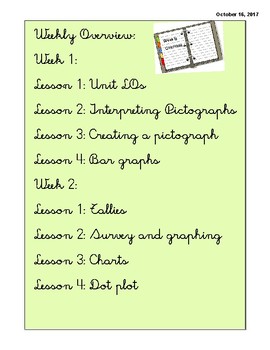
Graphing 2 week unit
This is a series of eight lessons, spread over two weeks. Each lesson involves differentiated activities, a lesson warm up and conclusion. The lessons are sequentially ordered.
Subjects:
Grades:
2nd - 3rd
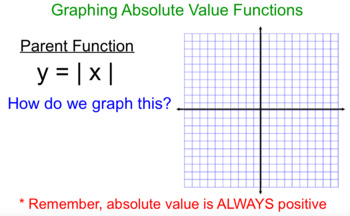
Graphing Absolute Value Function Notes
Editable Smart Notebook file on the process of graphing absolute value functions. Teacher-led with student practice problems included.
Grades:
7th - 10th
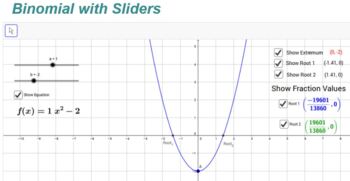
Understanding Binomial Equations
Uses Smart Notebook to display Binomial Equations and Graphs. But more than that, you can use "check boxes" to show (or not show):EquationExtremumOne or Both RootsGives you the ability to instantly change the binomial and its associated characteristics. Students can see in real time how changes to a binomial affect its graph.Page 1 shows how to use the interactive page (Page 2). Page 3 is a backup copy of the interactive page just in case...
Grades:
9th - 12th, Adult Education
Showing 1-22 of 22 results


