22 results
Adult education test preparation statistics interactive notebooks

Bible Study Lesson - Parables of Jesus with Digital Interactive Notebook
Learn about the Parables of Jesus with this Digital Interactive Notebook and Assessment Bundle. It is perfect for upper elementary, middle school, religious education, Catholic school, homeschool, and individual study. For use with Google Classroom and Google Drive, it is truly interactive with colorful, movable parts. It also includes tests and quizzes that are online and self-grading through Socrative.com.The notebook and assessment cover The Parable of the Bags of Gold (The Parable of the
Subjects:
Grades:
6th - 9th, Adult Education, Staff
Types:
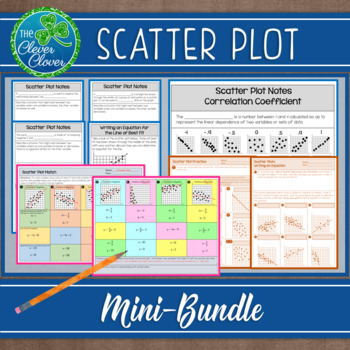
Scatter Plot Mini-Bundle
This resource includes six half pages of notes that are perfect for interactive notebooks. The first three pages introduce students to positive, negative and no correlation scatter plots. Students are asked to describe real world situations that might exist for each type of correlation. Students will graph three different sets of data in order to visualize the different types of scatterplots. Definitions for the line of best fit and correlation coefficient are provided. Each one of the half p
Subjects:
Grades:
6th - 9th, Adult Education
CCSS:
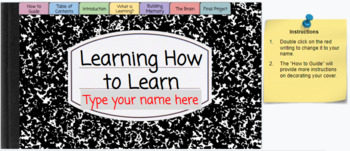
Learning How to Learn Companion Interactive Digital Notebook - Study Skills
Do you wish your students knew how to deepen their learning, stop procrastination, and maximize their studying? This interactive digital notebook is an engaging, no-prep solution. All you need to do is assign the notebook, created in Google Slides, to students through your learning management system (such as Google Classroom). Students will reflect on their current learning practices, learn effective and efficient study skills to benefit executive functioning, and develop skills to maximize thei
Grades:
6th - 12th, Adult Education
Types:
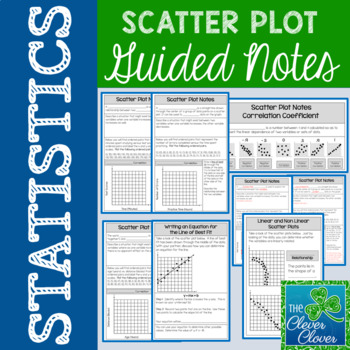
Scatter Plot Notes
This resource includes six half pages of notes that are perfect for interactive notebooks. The first three pages introduce students to positive, negative or no correlation scatter plots. Students are asked to describe real world situations that might exist for each type of correlation. Students will graph three different sets of data in order to visualize the different types of scatterplots. Definitions for the line of best fit and correlation coefficient are provided. Each one of the half pa
Subjects:
Grades:
6th - 9th, Adult Education
Types:
CCSS:
Also included in: Scatter Plot Mini-Bundle

Normal Distribution Foldable Popup
This is a popup of a normal distribution graph, showing students the probable spread of data within 1, 2, 3, and 4 standard deviations of the mean. The formulas for the population standard deviation and the sample standard deviation are both included. It is a great reference/graphic organizer for student notebooks and I have even had students who weren't in my class ask to join because they wanted this popup too. Useful for math or maths class, great for visual and kinesthetic learners, and
Subjects:
Grades:
9th - 12th, Higher Education, Adult Education
CCSS:
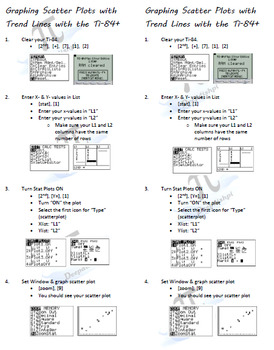
Scatterplots & Linear Regression (Trend Line) on Ti-84 (student notes)
This is a simple step-by-step list for student interactive notebooks.
Steps walk students through entering data, graphing the scatterplot and linear regression (tend line) in the Ti-83/84 family of graphing calculators. Screen shots of what the students see on their Ti are also included to encourage autonomy after initial instruction.
It is ready to be copied as a double-sided page and cut in half (long-wise), saving you precious paper! I hope you find this resource helpful!
TEKS
8.11(A)
Subjects:
Grades:
8th - 12th, Higher Education, Adult Education
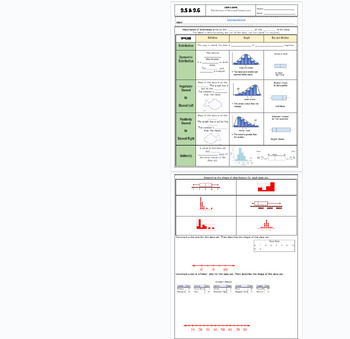
Data Distribution positive/negative skewed fillable notes UPDATED
Unit 9: Data and Stats: Updated(No 9.3/ Skip)9.5/9.6 Data Distribution (skewness)Students go over the vocabulary and complete the examples with the vocabulary scaffolded. Skewness is explained and how to identify it comparing data charts and box and whisker plots. Uses many visuals and examples to differentiate between that different graphs. Notes are scaffolded. Includes hook video hyperlinked on the "learning objective" title. Key is included and hyperlinked as a PDF in the heading highlighted
Subjects:
Grades:
6th - 12th, Higher Education, Adult Education
CCSS:
Also included in: Unit 9: Data and Statistics Fillable Notes
Standard Deviation Fillable Notes UPDATED
Unit 9: Data and Stats: Updated(No 9.3/ Skip)9.4 B Standard DeviationStudents go over the vocabulary and complete the examples with the vocabulary scaffolded. Standard deviation is long hand calculated by showing each step of the process (difference of squares). Real-world examples are explained in notes before calculating to show the importance of this stat and why it is used so often to verify valuable and effective data. Notes are scaffolded. Includes hook video hyperlinked on the "learning o
Subjects:
Grades:
7th - 12th, Higher Education, Adult Education
CCSS:
Also included in: Unit 9: Data and Statistics Fillable Notes
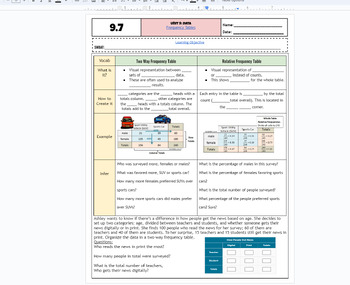
Frequency Tables & Relative Frequency Tables fillable notes UPDATED
Unit 9: Data and Stats: Updated(No 9.3/ Skip)9.7 Frequency Tables Students go over the vocabulary and complete the examples with the vocabulary scaffolded. Students examine a categorical table/frequency table and also use that information to create relative frequency tables. Different real-world examples and problems are used. Emphasized how percents and decimals are calculated. Notes are scaffolded. Includes hook video hyperlinked on the "learning objective" title. Key is included and hyperli
Subjects:
Grades:
6th - 12th, Higher Education, Adult Education
CCSS:
Also included in: Unit 9: Data and Statistics Fillable Notes
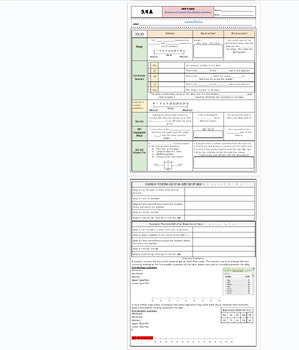
5 Number Summary and Box and Whisker Plots Fillable Notes UPDATED
Unit 9: Data and Stats: Updated(No 9.3/ Skip)9.4 A 5-number summary and box and whisker plot Students go over the vocabulary ad complete the examples with the vocabulary scaffolded. for each statistic with an explanation of the purpose of the 5 number summary and why these are used. Notes are scaffolded. Includes hook video hyperlinked on the "learning objective" title. Key is included and hyperlinked as a PDF in the heading highlighted in the orange box, and at the bottom of the google doc as w
Subjects:
Grades:
6th - 12th, Higher Education, Adult Education
CCSS:
Also included in: Unit 9: Data and Statistics Fillable Notes
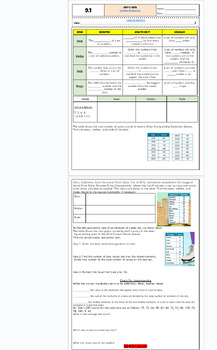
Central Tendencies: Mean, Median and Mode fillable notes: Updated
Unit 9: Data and Stats Updated9.1 Central Tendencies: mean median and modeStudents go over the vocabulary and how to find each average with examples. Notes are scaffolded. Includes hook video hyperlinked on the "learning objective" title. Key is included and hyperlinked as a PDF in the heading highlighted in the orange box, and at the bottom of the google doc as well. Google doc is editable, used in M1 HS
Subjects:
Grades:
6th - 12th, Higher Education, Adult Education
CCSS:
Also included in: Unit 9: Data and Statistics Fillable Notes
FREE DIGITAL SERVSAFE MANAGER (7TH EDITION) INTERACTIVE NOTEBOOK, CHAPTER ONE!!
I am listing my ServSafe Manager (7th Edition) Interactive Notebook, Chapter One for FREE!! This goes directly with the 10 chapter, ServSafe Manager Book. This interactive workbook is a LIFESAVER for anyone teaching ServSafe Manager, especially virtually or hybrid! Works with CANVAS and other online platforms. Students will gain a deep understanding of the ServSafe Manager content after interacting with this fun digital interactive workbook! The entire ServSafe Manager Interactive Workbook is a
Grades:
8th - 12th, Higher Education, Adult Education, Staff

Statistics
Powerpoint covering;-Statistical terms-Bias-Data skews-Standard deviation-Z-scores-Standard scores
Subjects:
Grades:
9th - 12th, Higher Education, Adult Education, Staff
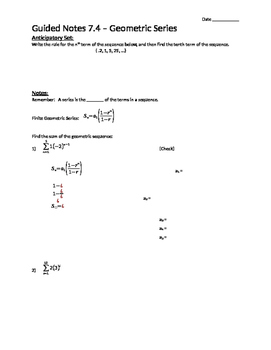
Geometric Series - Notes
Guided notes teaching students how to find the sum of finite and infinite geometric series written in sigma form as well as just in series form. The notes end with a real-world word problem. I also have a corresponding assignment of the same name.
Subjects:
Grades:
9th - 12th, Higher Education, Adult Education
Types:
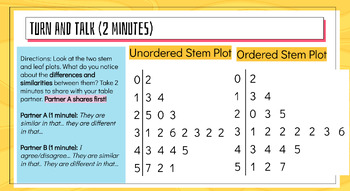
Lesson 1 PowerPoint: One Variable Data for Statistics: Dot Plots, Histograms,etc
This is a lesson (on powerpoint) about statistical distributions. The lesson includes practice problems and vocabulary relating to dot plots, stem plots, and describing/comparing statistical distributions. This is for secondary math (high schoolers). It includes some data collection activities and requires students to get involved in the lesson. If you teach with a tablet, iPad, or smart board, this template is writing-friendly. You can write on the presentation or edit it as you need for your c
Subjects:
Grades:
9th - 12th, Adult Education
Types:
CCSS:
Geometric Sequences - Notes
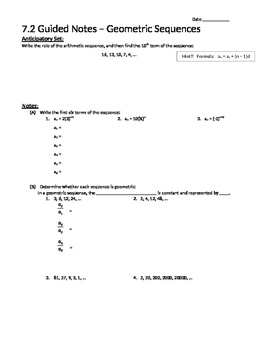
Guided notes teaching students how to write terms of a given sequence, determine if a sequence is geometric (and find the common ratio), write the rule for the nth term, and find a requested term when given a rule or a sequence. This also includes a review of arithmetic sequences from my previous notes (Arithmetic Sequences), as well as a real-life word problem. I also have a corresponding assignment of the same name.
Subjects:
Grades:
9th - 12th, Higher Education, Adult Education
Types:

Everything You Need to Teach Custer's Last Stand
If you're teaching about Westward Expansion, you'll be needing this great resource on General Custer, the Washita Massacre and Custer's Last Stand.
Students will learn to evaluate and compare/contrast historic sources on Custer's Last Stand.
This source book provides:
--primary sources (including eyewitness testimony and news articles, even reports by Custer himself!)
-secondary sources (encyclopedia entries, narrative history)
--timelines
--historical terms/vocabulary practice.
This is a f
Grades:
8th - 12th, Higher Education, Adult Education
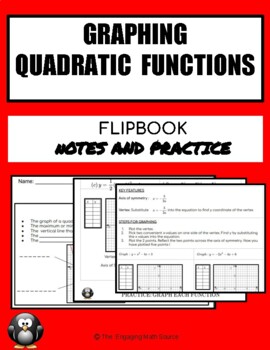
GRAPHING QUADRATIC FUNCTIONS -NOTES AND PRACTICE FLIPBOOK
This flipbook is a fun and organized way for students to take and keep their notes on graphing Quadratic equations. Students will graph quadratic equations in standard, vertex and intercept form.
Subjects:
Grades:
8th - 11th, Adult Education
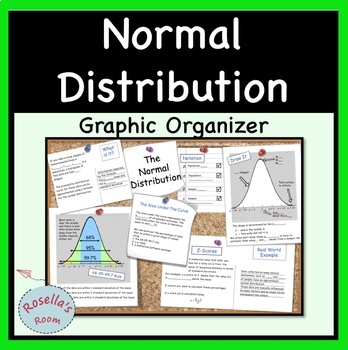
Normal Distribution Graphic Organizer
This graphic organizer summarizes:- properties of the normal distribution- the 68-95-99.7 rule- z-scoresIncluded are three scaffolded versions of the same graphic organizer; two are designed for students to fill in (one is left blank and the other has missing text) and the third is complete with all text. Great for revision.
Subjects:
Grades:
9th - 12th, Higher Education, Adult Education
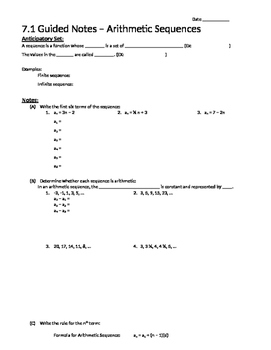
Arithmetic Sequences - Notes
Guided notes teaching students how to write terms of a given sequence, determine if a sequence is arithmetic (and find the common difference), write the rule for the nth term, and find a requested term when given a rule or a sequence. I also have a corresponding assignment of the same name.
Subjects:
Grades:
9th - 12th, Higher Education, Adult Education
Types:
Arithmetic Series - Notes
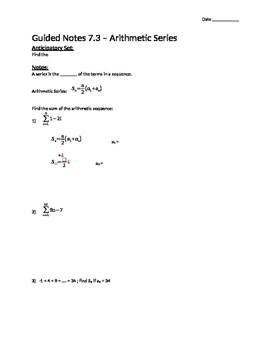
Guided notes teaching students how to find the sum of arithmetic series written in sigma form as well as just in series form. The notes include two real-world word problems. I also have a corresponding assignment of the same name.
Subjects:
Grades:
9th - 12th, Higher Education, Adult Education
Types:
CER Claim-Evidence-Reasoning Scientific Writing
Our globalized, technological world places new demands on students. For academic and career success, our students need to become critical thinkers and effective communicators of information. C-E-R style writing helps students practice those skills. This resource can be utilized to aid students in skillfully writing scientific arguments using evidence and reasoning. In this resource you will find:A flow chart outlining each component of C-E-R style writing An outline featuring TWO science example
Subjects:
Grades:
9th - 12th, Higher Education, Adult Education, Staff
CCSS:
NGSS:
HS-LS2-3
, HS-LS4-2
, HS-ESS1-3
, HS-ESS2-7
, HS-ESS3-1
...
Showing 1-22 of 22 results


