98 results
9th grade Common Core 8.F.B.5 handouts
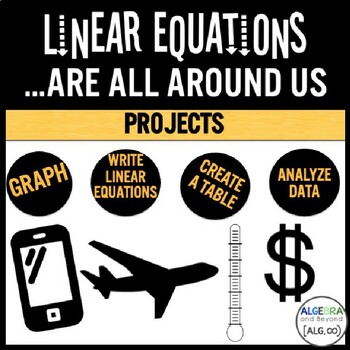
Graphing Linear Equations Project | Real World Functions PBL Activity | Algebra
Connect algebra to real life in this Graphing Linear Equations Project. This project based learning activity is perfect for students to write a linear equation, graph the function, and analyze characteristics of the graph. Plus, they have fun discovering that linear equations are all around us! This resource includes SIX different projects (100% editable) from basic to advanced levels of Pre-Algebra and Algebra.The real-life topics:• Cell phone plans• Hourly Wages• Frequent Flyer Miles• Temperat
Subjects:
Grades:
7th - 9th
Types:
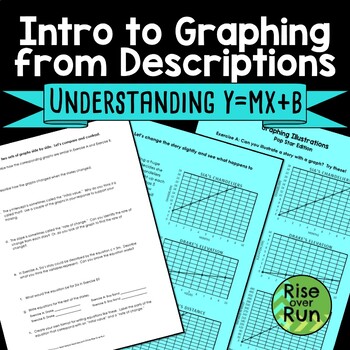
Graphing Intro to Creating Graphs from Descriptions
This linear graphing lesson introduces students to initial values, rates, and slope-intercept form. It is designed to interest students and use knowledge that students already have. Through it, students will explore and discover how stories, graphing, and equations all relate.In this activity:First, students are given 3 stories about pop stars to get them engaged and keep the lesson fun. The stories are straightforward. Students create graphs based on the stories.Next, the stories are change
Grades:
7th - 9th
Types:
Also included in: 8th Grade Math Activities & Lessons Bundle for the Whole Year
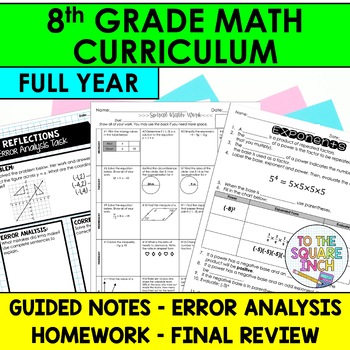
8th Grade Math Curriculum | 8th Grade Notes | Homework | Activities
8th Grade Math Curriculum Mega Bundle- Common Core Aligned for All Standards This bundle includes FREE versions of digital notes for distance learning. All digital notes have been added. This bundle includes notes, error analysis, homework and final review activities for the entire year! Included in this bundle: 8th Grade Math Guided Notes- 62 sets of guided notes8th Grade Math Homework for the year- Editable, spiraled weekly homework8th Grade Math Error Analysis Bundle- 62 different error analy
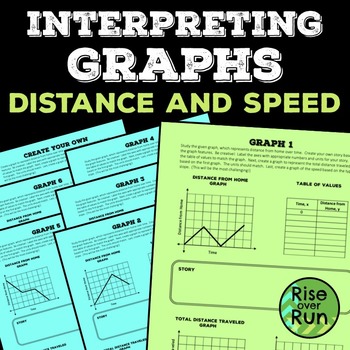
Interpreting Graphs with Distance and Speed Activity
In this series of activity sheets, students will interpret the meaning of a graph, relating variables and slope features. Students will extend the interpretation of graphs to create tables of values and additional related graphs.
Students can work through the activity individually, in partners, or in small groups.
On each sheet, students will study the given graph, which represents distance from home over time. They will interpret this graph by creating their own story and table of values
Grades:
8th - 9th
Types:
CCSS:
Also included in: 8th Grade Math Activities & Lessons Bundle for the Whole Year
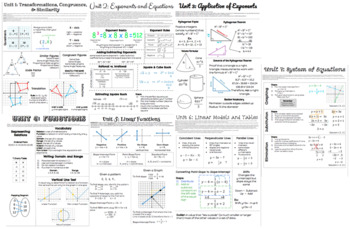
8th Grade Math Cheat Sheets ( Units 1 - 7)
This is a bundle of all condensed cheat sheet for 8th grade math following common core standards. On each unit cheat sheet, the students will be able to see the equations/steps to solve problems found within that unit. Best if printed on card stock. Unit 7 is best if printed in color.
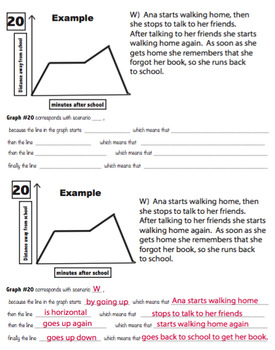
Qualitative Graphs with Sentence starters
In this lesson students will be able to match and describe the inclination of a line to each of the scenarios. There are 4 graphs in each set that matches with exactly one scenario. I included a handout for each set of graphs with sentence starters to help students that struggle when it comes to writing. I also included a blank template.
Subjects:
Grades:
7th - 9th
Types:
CCSS:
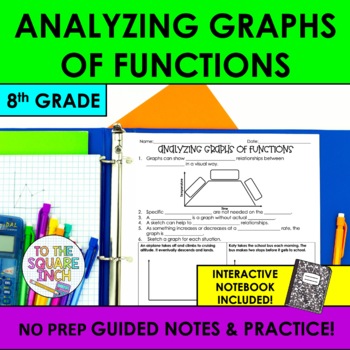
Analyzing Graphs of Functions Notes & Practice | Guided Notes
Searching for an effective way to teach your students how to analyze graphs of function? These NO PREP guided notes are a classroom proven resource that will save you time and have your students proficient in analyzing graphs of function in no time! With a comprehensive design, these notes offer a structured approach that can be differentiated for every level of learner. Guided notes are an effective teaching model that maximize your students ability to use working memory to focus on content, ra
Subjects:
Grades:
7th - 9th
CCSS:
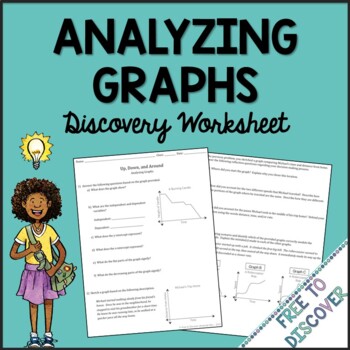
Analyzing Graphs Worksheet
By completing this analyzing graphs discovery-based worksheet, students will be able to describe the relationship between two quantities by analyzing a graph, sketch a graph based on a verbal description, and reflect on their mathematical choices in an effort to deepen conceptual understanding.A document camera and/or projector are recommended resources that can facilitate classroom discussion.This product is part of the Discovery-Based Worksheet Series. Discovery-Based Worksheets have been spe
Grades:
7th - 9th
Types:
CCSS:
Also included in: 8th Grade Math Curriculum Mega Bundle
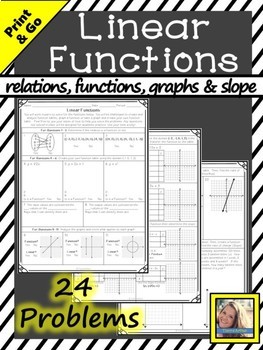
Linear Functions Review Packet
Looking for a study guide to review Linear Functions? This three-page packet will suit your needs! Using/creating function tables, working with inputs and outs (domain/range), determining if a relation is a function from ordered pairs, graphing from a function table, calculating slope using two methods (formula and graphically) and real world word problems. Includes 24 problems with a detailed answer key! Many ways to use this product including reviewing for formal assessment, center packet,
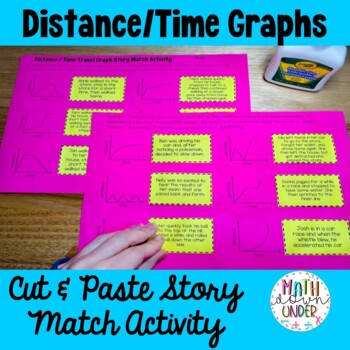
Distance Time Graph Story Match Activity! Cut and Paste
Your students will love this cut and paste activity that practice reading motion graphs (distance time graphs). 12 travel stories to match to the appropriate distance/time graph. Entire activity is included in the preview file. Follow my store and thank you for your support!Acceleration and deceleration examples included! Want a paperless version? You can find it here! ▶️ Distance Travel Graph Story Match - Drag and Drop using Google Slides!
Subjects:
Grades:
5th - 9th
Types:
Also included in: Distance Time Graph Story Match - Print & Digital Bundle
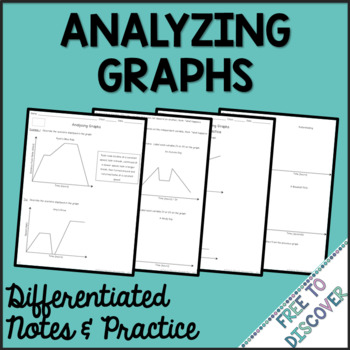
Analyzing Graphs Notes and Practice
In these activities, students practice analyzing graphs. Students will be able to write a verbal description to match a graph, draw a graph to match a verbal description, and identify the independent and dependent variable given a first quadrant graph. These notes and practice worksheets are differentiated based on some common needs found in the middle school math classroom. Modifications are considered for both struggling learners and high flyers. Differentiated Notes Include:Traditional No
Subjects:
Grades:
7th - 9th
CCSS:
Also included in: 8th Grade Math Curriculum Mega Bundle
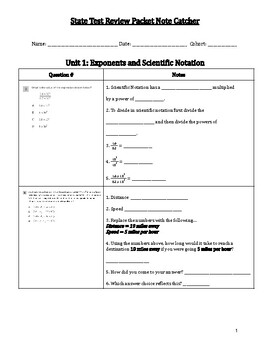
Math 8 State Test Prep
This bundle includes two separate packets for math state test prep. One packet includes redistributed released state test questions where topics are chunked together. The other packet takes each question and provides 3 - 10 scaffolding questions to help students elicit the correct response. Scaffolding questions include references to previous learning and ways to rethink complicated state test wording. This packet can be covered over the course of a week (with two units completed each day) for j
Subjects:
Grades:
7th - 9th
Types:
Also included in: Math State Test Prep Bundle
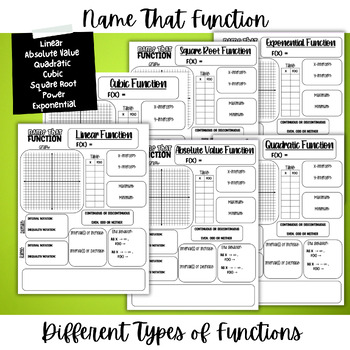
Different Types of Functions | Name That Function | Function Characteristics
Different Types of Functions | Name That Function | Function CharacteristicsLooking for a way to organize your functions?These function templates are perfect for students to keep track of each function they learn about. Different Types of Functions:Linear, Absolute Value, Quadratic, Cubic, Square Root, Power, and ExponentialStudents can analyze each function by creating a graph and table. Students can identify x- and y-intercepts, minimum and maximum, domain and range (interval and inequality no
Subjects:
Grades:
8th - 12th
Types:
CCSS:
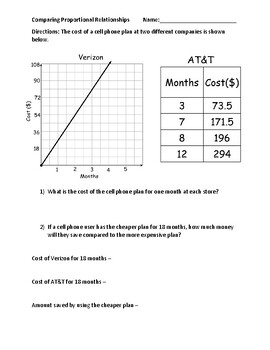
Comparing Proportional Relationships (Graphs, Data Tables and Equations)
A combination of 4 worksheets that will help students comparing proportional relationships expressed in different forms. Students need to find the unit rate of the representation in order to compare between graph, data tables and equations. Use as a whole packet or as individual worksheets.
Subjects:
Grades:
6th - 9th
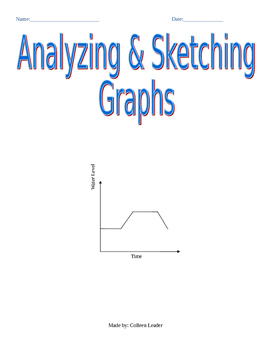
Analyzing & Sketching Graphs Lesson
This activity requires students to analyze qualitative graphs and explain what they represent. Some of the problems ask students to match scenarios to graphs, some require students to explain a graph in their own words, and finally the last problems ask students to construct a qualitative graph based on a description.
Functions Notes and Practice Bundle
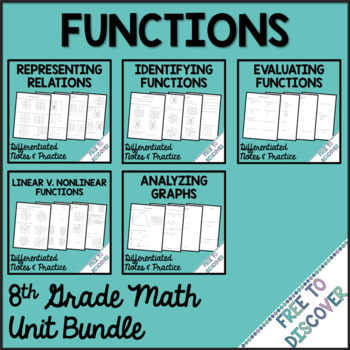
This Functions Bundle contains differentiated notes and practice for five lessons. Topics include representing relations as a graph, table, mapping, and set of ordered pairs; stating domain and range; identifying functions given a graph, table, mapping, and set of ordered pairs; evaluating functions given "y=" form or function notation; identifying linear or nonlinear functions given a table, equation, or graph; and analyzing graphs.Differentiated Notes Include:Traditional Notes – These are bas
Subjects:
Grades:
7th - 9th
Functions Reference Sheet
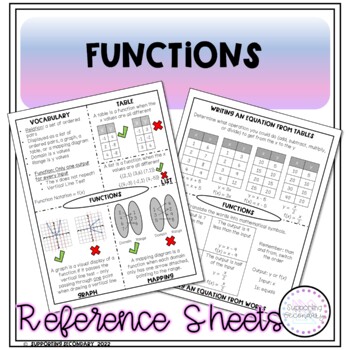
Need something that is a quick print and go? This Functions Reference Sheet can be printed front and back to make it a one-pager. Perfect for use as a reference sheet throughout a unit, at the beginning prior to the lesson, or at the end as a review sheet/study guide before an assessment. These reference sheets can also be used for those students whose IEP's include accommodations such as visual aids or rule cards.This reference sheet includes: Definition of Relation and FunctionDefinition of Do
Subjects:
Grades:
7th - 9th
Types:
Also included in: Middle School Math Reference Sheet Bundle
The Periodic Trends of Ionization Energy
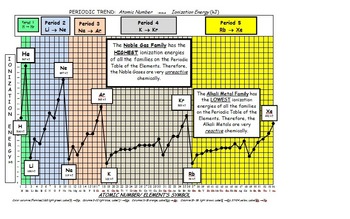
This graphing activity, Atomic Number vs. Ionization Energy, will help students grasp a very difficult, but critical, concept in chemistry. This graphing activity includes 3 graphing worksheets for varying levels of ability. Data sheets of the first 54 elements and their ionization energies are also included. A completed graph is included.
Students will observe how ionization energy changes from left to right across the periodic table and from top to bottom of a family. These worksheets will h
Subjects:
Grades:
8th - 12th
Types:
CCSS:

Function Notation and Linear Equations through Context
The student activities (Non-answer Keys) will consist of the following:- Context to be annotated- Completing a Table with data from an Equation- Review of Domain, Function, Range- Graphing Domain and Range Data- Identifying solutions from a Table- Substituting for input (x) when solving for the output (y) in function notation- Substituting for output (y) when solving for the input (x) in function notation- Writing solutions as ordered pairs- Written responses of all steps- QR code for additional
Subjects:
Grades:
8th - 9th
Types:
CCSS:
Daily Algebra Warm-Ups with Weekly Quiz Quarter 2
Increase retention in Algebra with daily warm-ups that incorporate spiral review. Day 1-4: 5-7 minute warm-up. Day 5: Quiz that covers topics reviewed that week. Practice Makes Permanent!
Subjects:
Grades:
8th - 10th
Types:
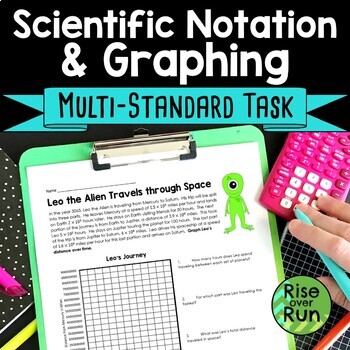
8th Grade Math Task for Scientific Notation and Graphing
Challenge students to use scientific notation and graphing to complete this activity! Students will read a story, answer questions, and create a graph. The activity addresses the following topics:Scientific NotationGraphing Contextual EventsDistance, Rate, and TimeUnit Price / Better BuyGreat activity for partners, end of year testing review, or engaging practice. This is a one-page handout with an answer key in PDF format.Suggested Resources:8th Grade Math BundleScientific Notation Guided
Subjects:
Grades:
8th - 9th
Types:
Also included in: 8th Grade Math Activities & Lessons Bundle for the Whole Year
Evaluating Linear Equation to Create Table & Graph
Students are given 4 word problems related to hosting a party. They are given a fee and cost per person. They use this information to create the linear equation that represents the word problem. They utilize the equation to evaluate based on the number of guests. They then use the information to fill in the table and graph that represent the word problem.
Subjects:
Grades:
8th - 12th
Types:
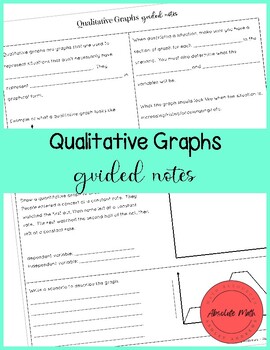
Qualitative Graphs Guided Notes
This resource includes:- drawing qualitative graphs from a given situation- writing a situation to describe a quantitative graph
Subjects:
Grades:
7th - 10th
CCSS:
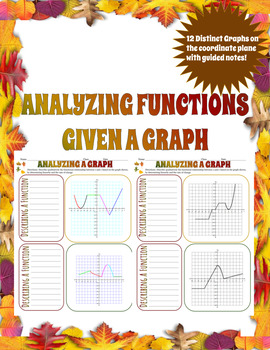
Qualitative/Analyzing Graphs
Students focus on describing the characteristics of linear and nonlinear functions. Students describe specific sections of a graph over which the output is increasing, decreasing or constant. Students describe which sections of the graph are linear and which are nonlinear. Students may use compound inequalities describing sections of a graph, but can be allowed to use the word "to" instead.
Subjects:
Grades:
8th - 11th
Types:
CCSS:
Showing 1-24 of 98 results

