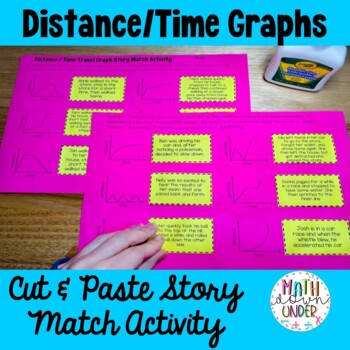
Distance Time Graph Story Match Activity! Cut and Paste
Math Down Under
923 Followers
Grade Levels
5th - 9th, Homeschool
Subjects
Resource Type
Standards
CCSS8.EE.B.5
CCSS8.F.B.5
Formats Included
- PDF
Pages
3 pages
Math Down Under
923 Followers
What educators are saying
Such a great resource for my students! All students were engaged and used the assignment as a way to review the concepts. Thank you!
My students were struggling with connecting the graph with the scenario but this activity helped them understand it better.
Also included in
- Grab a bargain with this bundle of print and digital story match activities for distance time graphs (interpreting motion graphs). 3 PDF pages for printing and the digital, Google Slides version (4 Slides). This is the same resource and questions, but one is for printing and the other is digital.ThePrice $4.00Original Price $5.00Save $1.00
Description
Your students will love this cut and paste activity that practice reading motion graphs (distance time graphs). 12 travel stories to match to the appropriate distance/time graph. Entire activity is included in the preview file. Follow my store and thank you for your support!
Acceleration and deceleration examples included!
Want a paperless version? You can find it here!
▶️ Distance Travel Graph Story Match - Drag and Drop using Google Slides!
Total Pages
3 pages
Answer Key
Included
Teaching Duration
N/A
Report this resource to TPT
Reported resources will be reviewed by our team. Report this resource to let us know if this resource violates TPT’s content guidelines.
Standards
to see state-specific standards (only available in the US).
CCSS8.EE.B.5
Graph proportional relationships, interpreting the unit rate as the slope of the graph. Compare two different proportional relationships represented in different ways. For example, compare a distance-time graph to a distance-time equation to determine which of two moving objects has greater speed.
CCSS8.F.B.5
Describe qualitatively the functional relationship between two quantities by analyzing a graph (e.g., where the function is increasing or decreasing, linear or nonlinear). Sketch a graph that exhibits the qualitative features of a function that has been described verbally.


