Interpreting Graphs with Distance and Speed Activity
Rise over Run
24.1k Followers
Resource Type
Standards
CCSS8.F.B.5
CCSSHSF-IF.B.4
Formats Included
- PDF
Pages
9 pages
Rise over Run
24.1k Followers
What educators are saying
My students loved creating their own stories. This activity was engaging and a great way for my students to demonstrate mastery in a non "mathy" way. I used this along with the district-provided curriculum. This is a great way to extend the differentiation of products within the classroom.
Also included in
- If you enjoy teaching students using discovery learning and engaging activities with real world connections, this huge pack of resources is here to help you plan your entire year of 8th grade math.Lessons help you teach the standards, encourage discussions, and challenge students to think. StudentsPrice $225.00Original Price $386.46Save $161.46
- Do you love discovery learning, collaboration, hands-on activities, and projects that help students make sense of the math they are learning? This curriculum is packed with engaging and challenging Algebra I and 8th grade math resources for the whole year. A variety of activities, inquiry learningPrice $350.00Original Price $677.94Save $327.94
- This curriculum bundle includes a variety of activities, assessments, games, group activities, projects, inquiry lessons, guided notes, and more for teaching Algebra I CCSS standards. The activities are centered on discovery learning and engaging activities with real world connections. Lessons helpPrice $225.00Original Price $445.21Save $220.21
- Help your students make sense of interpreting graphs with these engaging lessons! The focus is thinking about the shapes of graphs and what increasing or decreasing means in each real world situation. Here is what is included:Interpreting Graphs Introduction PowerPoint & 2 Practice TasksPass thPrice $6.50Original Price $9.99Save $3.49
Description
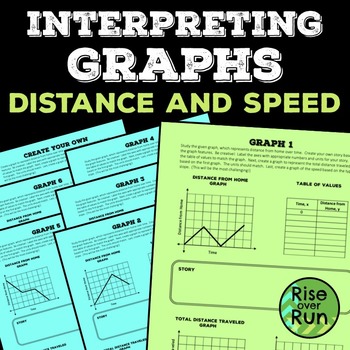
In this series of activity sheets, students will interpret the meaning of a graph, relating variables and slope features. Students will extend the interpretation of graphs to create tables of values and additional related graphs.
Students can work through the activity individually, in partners, or in small groups.
On each sheet, students will study the given graph, which represents distance from home over time. They will interpret this graph by creating their own story and table of values based on the graph features. Students can be creative! The graph may represent a person walking from home, a bird leaving its nest, an ant crawling from its anthill, or numerous other scenarios. Next, students create a graph to represent the total distance traveled based on the first graph. Last, students create a graph of the speed based on the types of slope. (This will be the most challenging!)
A blank graph sheet is provided so students can create their own.
In this download, you will receive PDFs of the 6 graphing sheets, 1 blank graphing sheet, lesson guide, and sample answer for the first sheet. Check out the preview!
Common Core Standards:
CCSS.Math.Content.8.F.B.5
Describe qualitatively the functional relationship between two quantities by analyzing a graph (e.g., where the function is increasing or decreasing, linear or nonlinear). Sketch a graph that exhibits the qualitative features of a function that has been described verbally.
CCSS.Math.Content.HSF.IF.B.4
For a function that models a relationship between two quantities, interpret key features of graphs and tables in terms of the quantities, and sketch graphs showing key features given a verbal description of the relationship. Key features include: intercepts; intervals where the function is increasing, decreasing, positive, or negative; relative maximums and minimums; symmetries; end behavior; and periodicity.
Thank you for your interest in this activity by Rise over Run.
Suggested Resources:
8th Grade Math Mega Bundle
Graphing Bundle
Total Pages
9 pages
Answer Key
N/A
Teaching Duration
1 hour
Report this resource to TPT
Reported resources will be reviewed by our team. Report this resource to let us know if this resource violates TPT’s content guidelines.
Standards
to see state-specific standards (only available in the US).
CCSS8.F.B.5
Describe qualitatively the functional relationship between two quantities by analyzing a graph (e.g., where the function is increasing or decreasing, linear or nonlinear). Sketch a graph that exhibits the qualitative features of a function that has been described verbally.
CCSSHSF-IF.B.4
For a function that models a relationship between two quantities, interpret key features of graphs and tables in terms of the quantities, and sketch graphs showing key features given a verbal description of the relationship.


