
Graphing Intro to Creating Graphs from Descriptions


- PDF
What educators are saying
Also included in
 If you enjoy teaching students using discovery learning and engaging activities with real world connections, this huge pack of resources is here to help you plan your entire year of 8th grade math.Lessons help you teach the standards, encourage discussions, and challenge students to think. StudentsPrice $225.00Original Price $386.46Save $161.46
 Do you love discovery learning, collaboration, hands-on activities, and projects that help students make sense of the math they are learning? This curriculum is packed with engaging and challenging Algebra I and 8th grade math resources for the whole year. A variety of activities, inquiry learningPrice $350.00Original Price $677.94Save $327.94
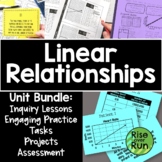 Want linear functions lessons that are engaging to students and have real world applications? This unit is packed with tasks activities to help your students understand graphing linear equations!Included topics:Proportional RelationshipsSlopeSlope-Intercept FormPoint-Slope FormStandard FormThe activPrice $42.00Original Price $58.50Save $16.50
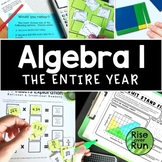 This curriculum bundle includes a variety of activities, assessments, games, group activities, projects, inquiry lessons, guided notes, and more for teaching Algebra I CCSS standards. The activities are centered on discovery learning and engaging activities with real world connections. Lessons helpPrice $225.00Original Price $445.21Save $220.21
Description
This linear graphing lesson introduces students to initial values, rates, and slope-intercept form. It is designed to interest students and use knowledge that students already have. Through it, students will explore and discover how stories, graphing, and equations all relate.
In this activity:
First, students are given 3 stories about pop stars to get them engaged and keep the lesson fun. The stories are straightforward. Students create graphs based on the stories.
Next, the stories are changed slightly (to include a new "initial value"). Students draw new graphs to illustrate the new story.
Then, through a series of questions, students compare the graphs. The questions provided are great for class discussions on topics of initial value, rate of change, and slope-intercept form.
Finally, students create their own stories, graphs, and equations.
Great to use as a partner activity!
In this download, you will receive in PDF format:
4 pages of student handouts
Answer key
