10 results
12th grade statistics graphic organizers for Microsoft PowerPoint
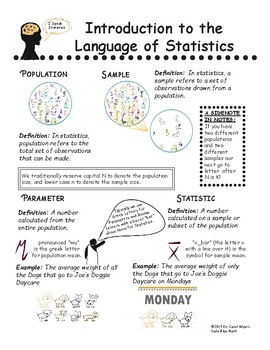
Introduction to the Language of Statistics - SketchNotes and Lecture Slides
This is a guided lecture that covers the basic vocabulary of Statistics, including Population, Statistic, Types of Data, Types of Sampling and Types of Studies. The lecture notes use simple pictures, icons and examples to help students visualize the language. The lesson includes: Teacher Notes4-pages of SketchNotes completely filled in4-pages of SketchNotes with blanks for students to fill inA 10 question (1 page) Knowledge Check for formative assessmentThe answer key for the Knowledge CheckA
Subjects:
Grades:
10th - 12th, Higher Education
CCSS:

Key Performance Data Dashboards Bundle
Bundle includes presentation slides, printable graphic organizer for written practice, virtual graphic organizer for online practice, final project template and rubric.Student assignments are in three parts:Part 1: Print out KPI graphic organizer on 11x17 for students to draw sample charts showcased on presentation slides.Part 2: Virtual graphic organizer practice on Canva.Part 3: Final KPI Dashboard project Canva template.
Subjects:
Grades:
8th - 12th, Higher Education, Adult Education
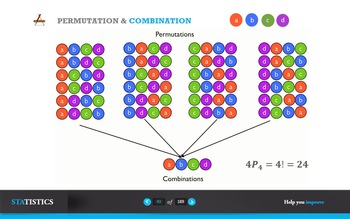
Permutation and Combination
• understand the terms permutation and combination, and solve simple problems involving selections;
• solve problems about arrangements of objects in a line, including
those involving:
• repetition (e.g. the number of ways of arranging the letters of the
word ‘NEEDLESS’),
• restriction (e.g. the number of ways several people can stand in
a line if 2 particular people must — or must not — stand next to
each other).
Subjects:
Grades:
10th - 12th, Higher Education, Staff
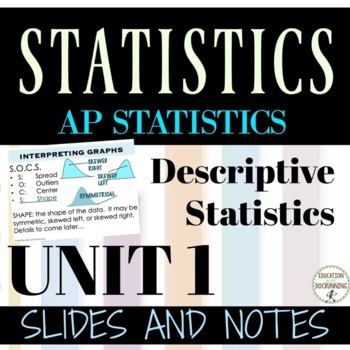
One Variable Data AP Statistics Unit 1 Slides and Guided Notes
AP Statistics UNIT 1 Guided notes and slides to help your AP Statistics students master the concepts for Unit 1 Exploring One and Two Variable Data.Note: If you have purchased AP STATISTICS Full Curriculum or Unit 1 AP Statistics, you already have these resources. You do NOT need to purchase this.There are 7 slide presentations and accompanying guided notes. All of the resources are 100% editable, to modify to fit your classroom needs. The zip folder includes the Word document, which you have pe
Subjects:
Grades:
9th - 12th
CCSS:
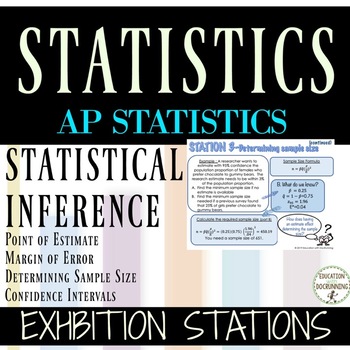
Confidence Intervals slides Notes
Check out this set of statistical inference stations- your students will love learning about point of estimate, margin of error and more exhibition style! Students can travel from station to station - OR- you can print smaller versions and have the students use the cards as independent centers - OR- you can display the powerpoint slides at individual stations. Student response sheet helps guides students through their learning. Best of all they are learning on their own, and you can skip the l
Subjects:
Grades:
9th - 12th
CCSS:
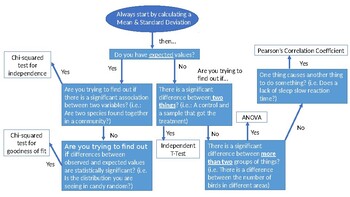
IB Biology: Internal Assessment Statistical Analysis Decision Tree
This product is a PowerPoint slide that can be modified to meet your needs and saved as a PDF to digitally provide to students. I had noticed that my students struggled with determining which statistical analysis was most appropriate for their Internal Assessment, so I created a decision tree for them. By being able to answer the questions on the decision tree, they will be able to appropriately analyze their data and reach their conclusion.
Subjects:
Grades:
11th - 12th, Higher Education, Adult Education
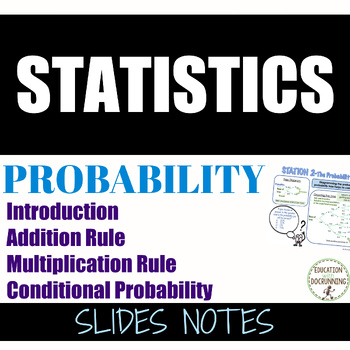
Probability Slides and Notes
Check out this set of probability stations- your students will love learning about probability and conditional probability exhibition style! Students can travel from station to station - OR- you can print smaller versions and have the students use the cards as independent centers - OR- you can display the powerpoint slides at individual stations. Student response sheet helps guides students through their learning. Best of all they are learning on their own, and you can skip the lecture! Incl
Subjects:
Grades:
9th - 12th
CCSS:
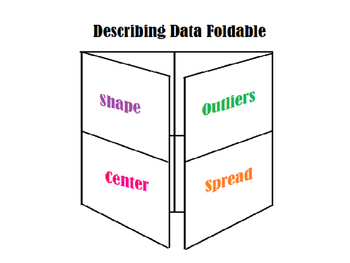
Analyzing Data Foldable
This is a foldable designed to review how to analyze data. It includes finding the mean, median, IQR, and possible outliers. Some of the foldable describes calculator steps with the TI-83 or TI-84. It can be edited in case you do not want to include calculator directions.There is additional information on the back of the foldable about normal distribution problems and calculator steps. This can be eliminated all together..
Subjects:
Grades:
8th - 12th
Also included in: Data Analysis Foldable Bundle
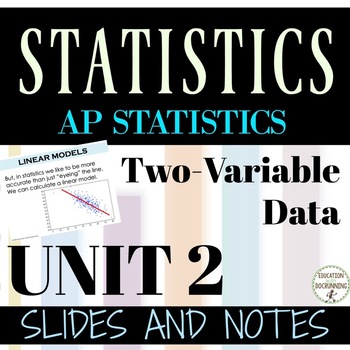
2 Variable Data AP Statistics Unit 2 Slides and Guided Notes
AP Statistics UNIT 2 Guided notes and slides to help your AP Statistics students master the concepts for Unit 2 Two Variable Data.Note: If you have purchased AP STATISTICS Full Curriculum, you already have these resources. You do NOT need to purchase this.There are 6 slide presentations and accompanying guided notes. All of the resources are 100% editable, to modify to fit your classroom needs. The zip folder includes the Word document, which you have permission to edit completely, and the power
Subjects:
Grades:
10th - 12th
CCSS:
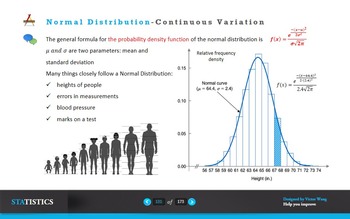
Normal Distribution
1)understand the use of a normal distribution to model a continuous
random variable, and use normal distribution tables;
solve problems concerning a variable X, where X ~ N, including:
finding the value of P(X > x1), or a related probability, given the
values of x1,
2)finding a relationship between x1, and given the value of
P(X > x1) or a related probability;
3)recall conditions under which the normal distribution can be used
as an approximation to the binomial distribution (n large enou
Subjects:
Grades:
10th - 12th
Showing 1-10 of 10 results


